By Andrew Shaw, REALTOR® with REAL Broker · October 2, 2026
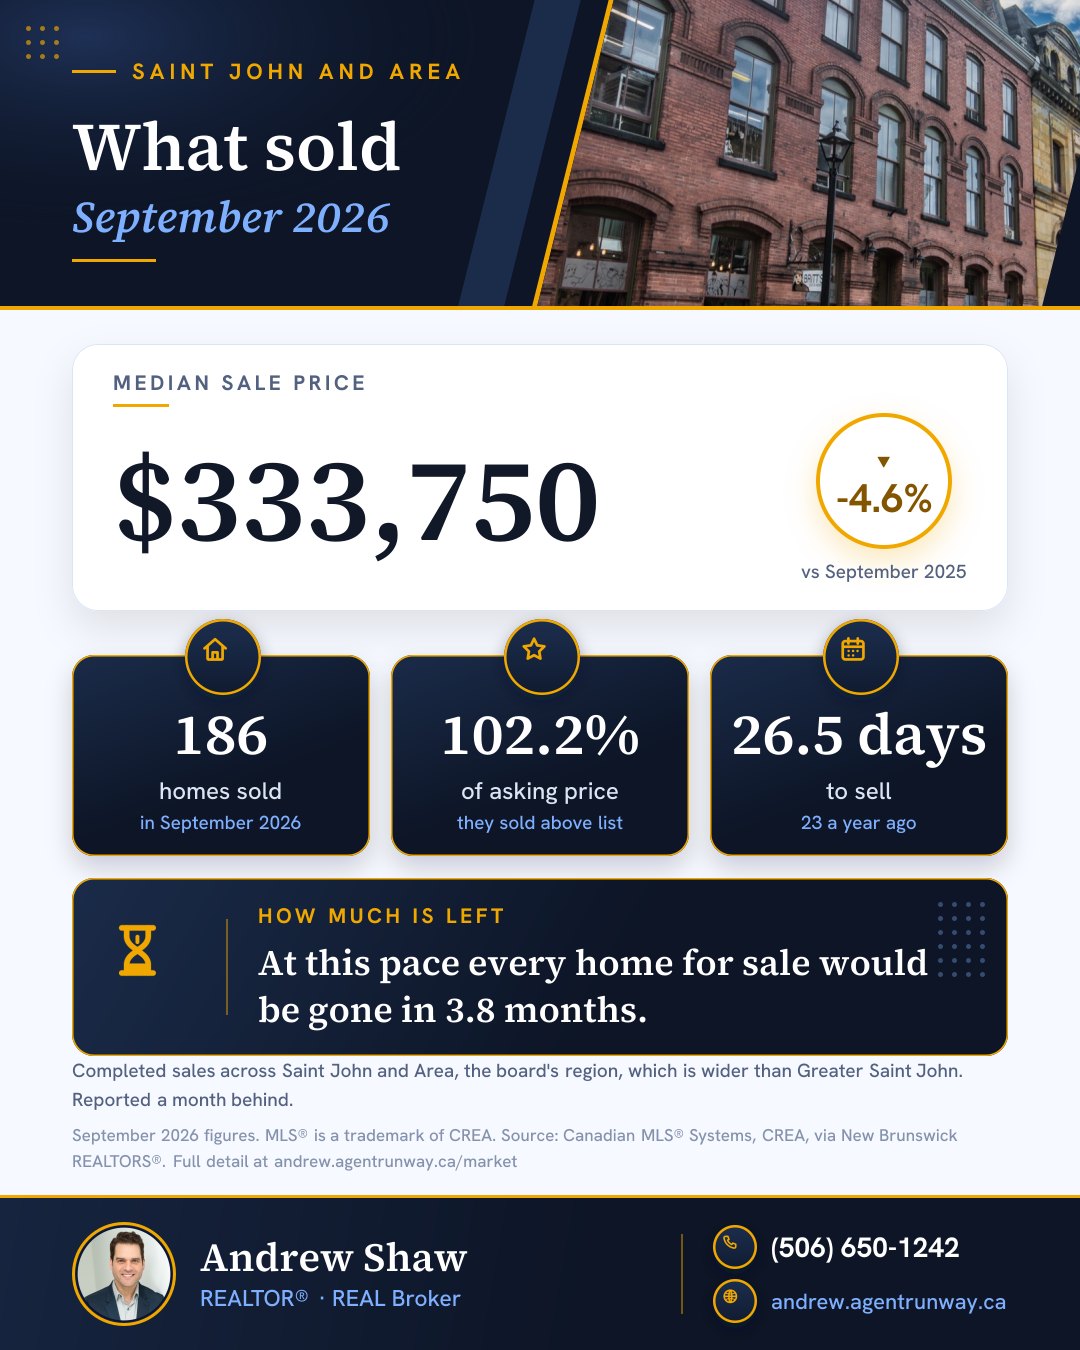
September in a nutshell
186
homes sold
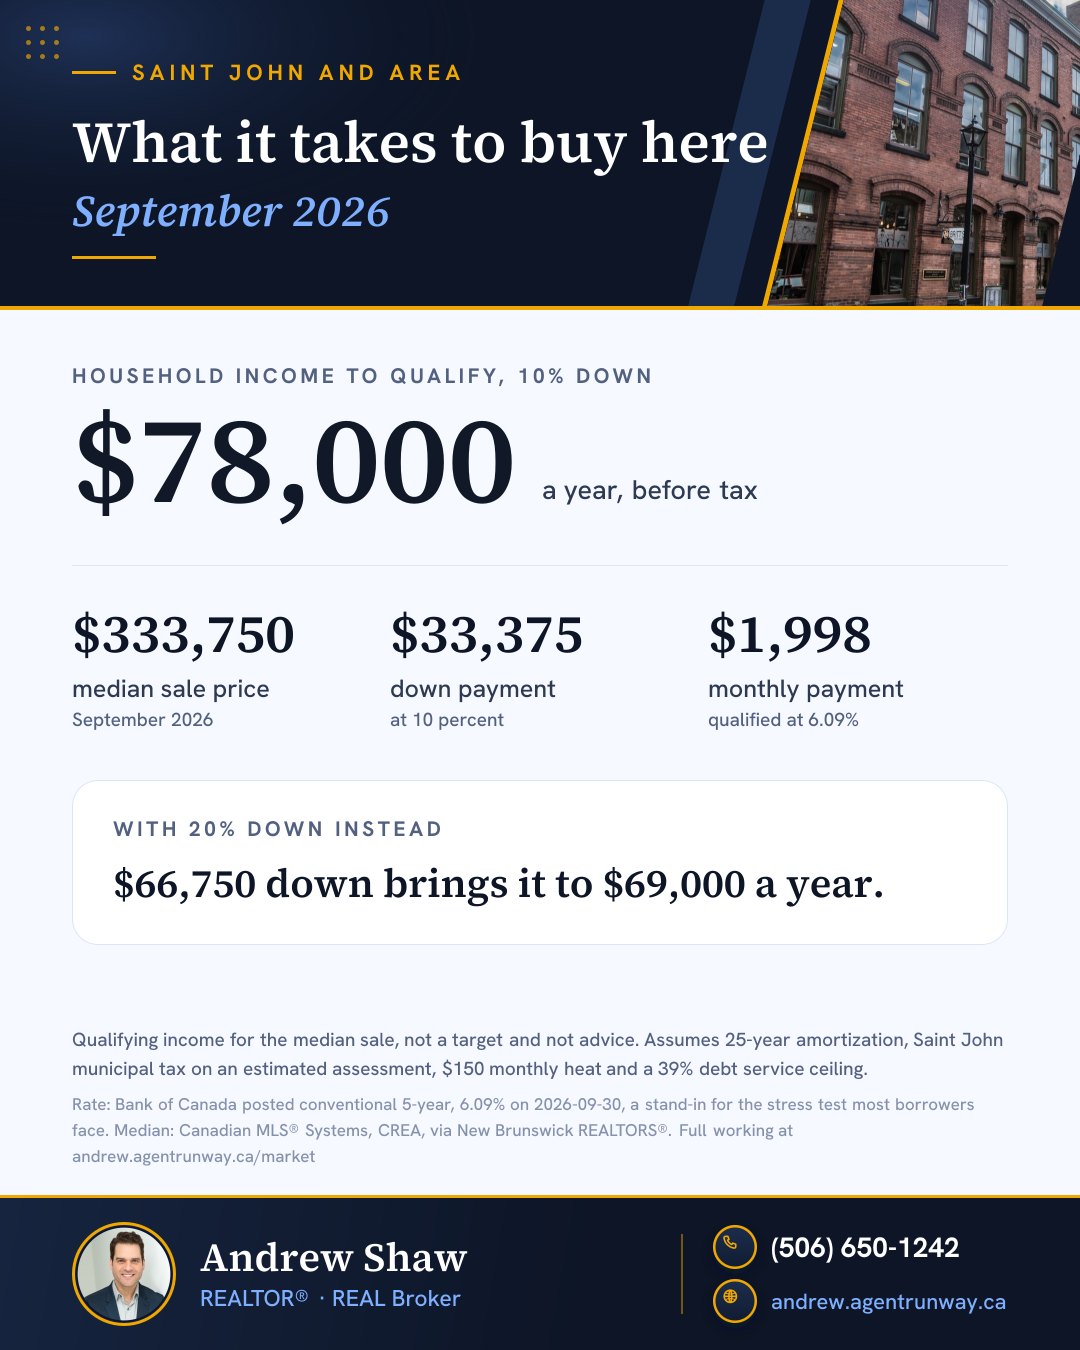
$333,750
median sale price
102.2%
of asking price
26.5
days to sell
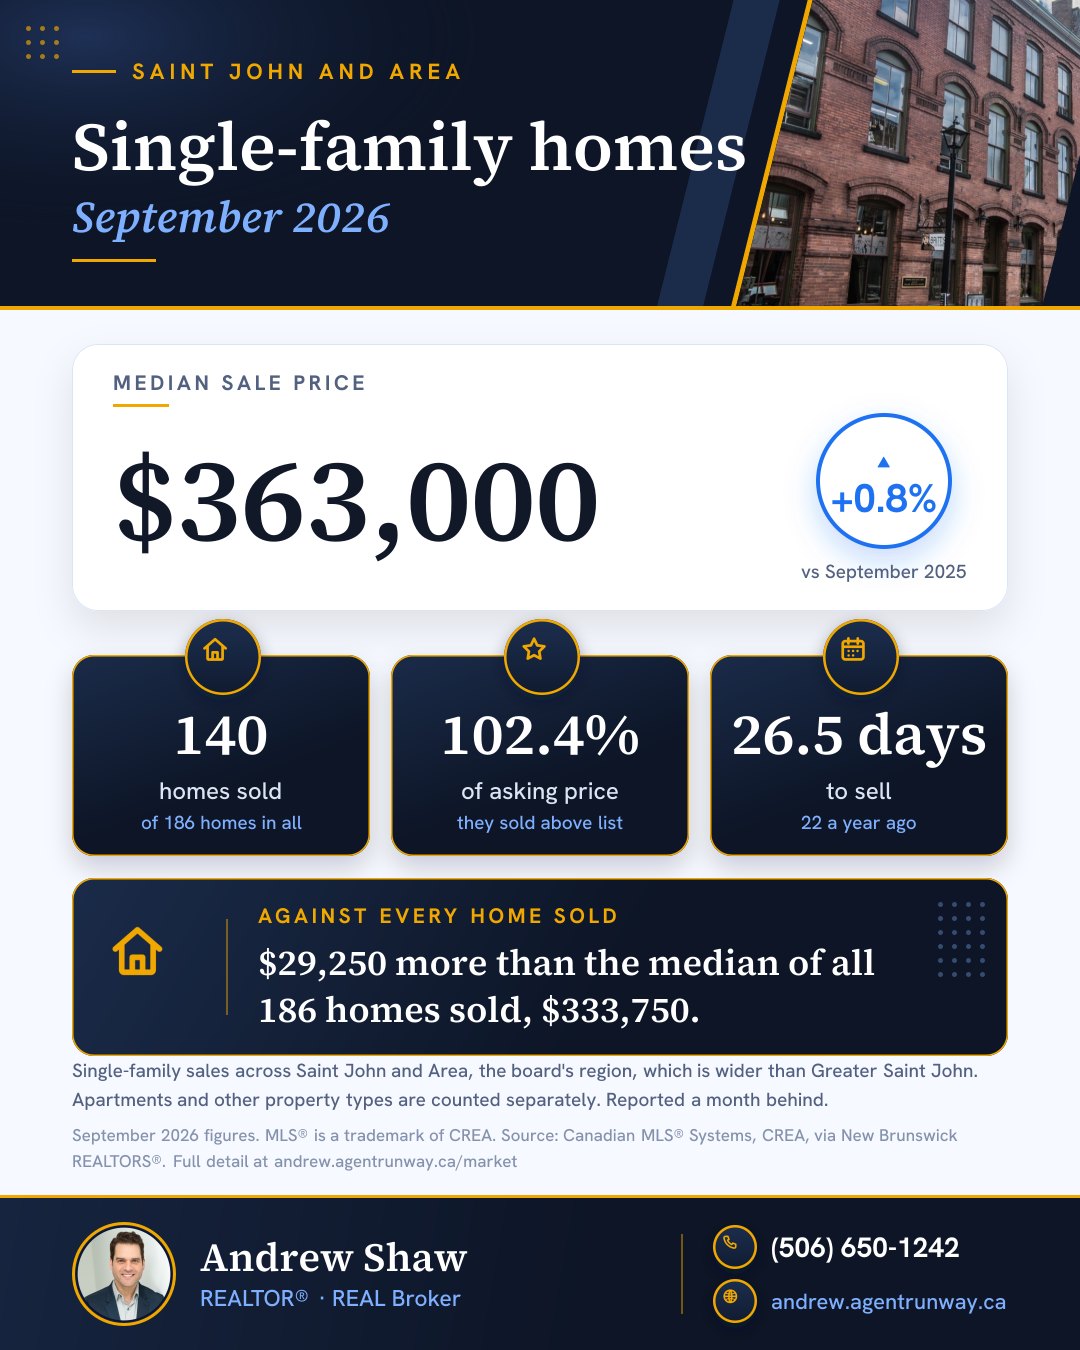
The median sale price came in 4.6% below last September, which sounds like news until you look at what sold. Single-family homes made up 75% of September’s sales, down from 85% a year earlier. When fewer houses are in the mix, the middle price for everything drops even if house prices haven’t moved.
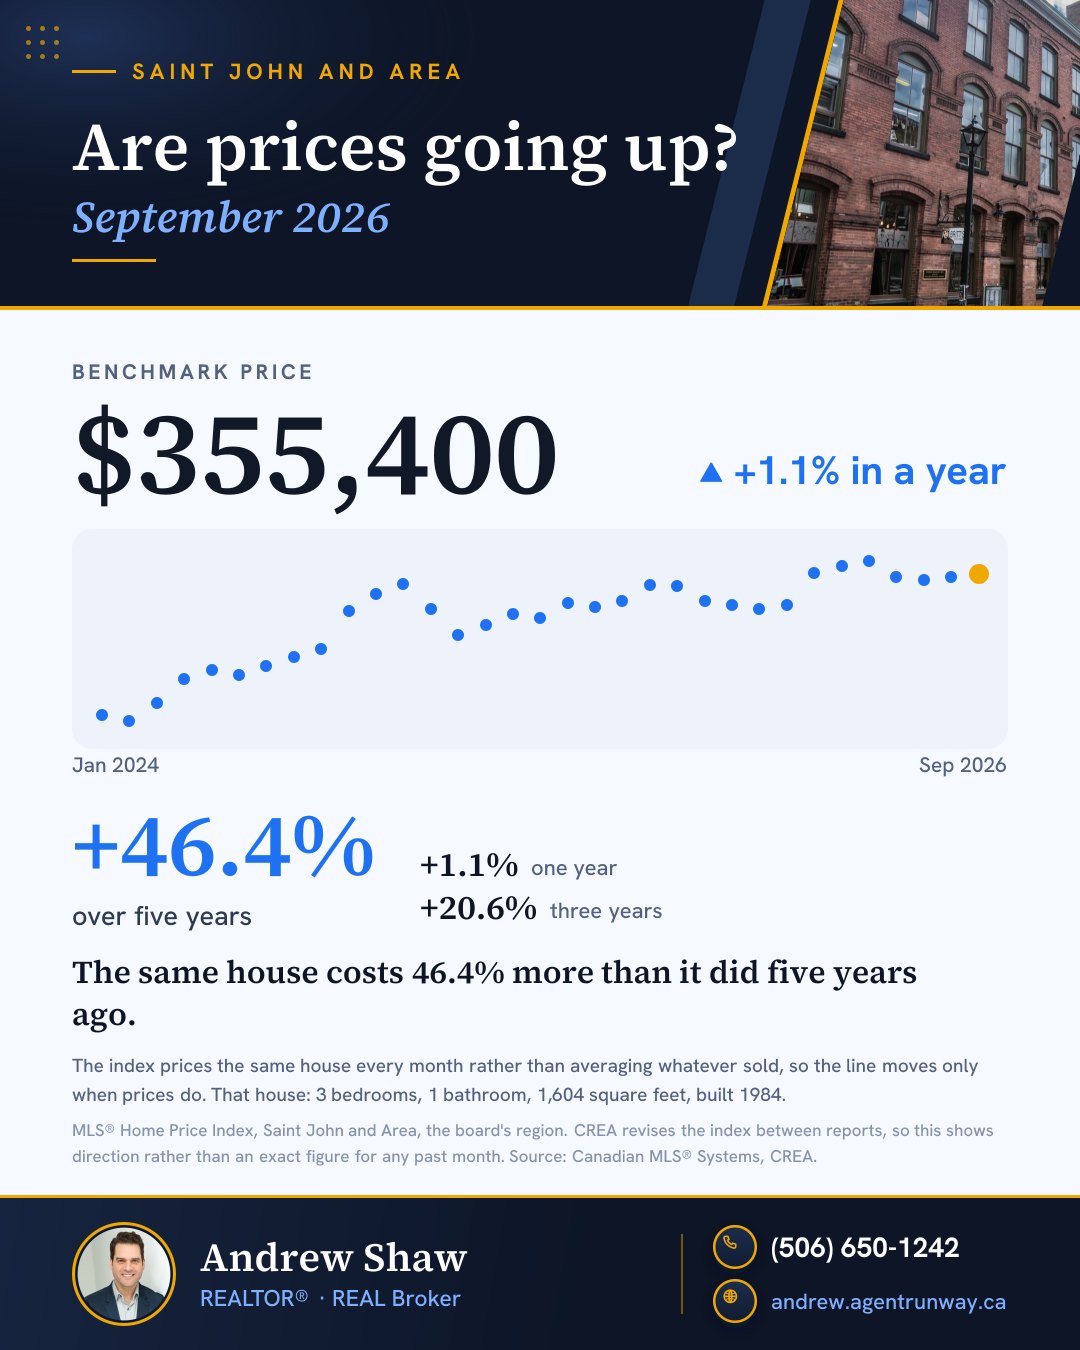
And they hadn’t, much. Single-family homes on their own sold for a median of $363,000, up 0.8% on last September. The board’s benchmark price, which tracks the same typical home every month, sits at $355,400, up 1.1% on a year ago.
The year so far, against last year
If you’ve ever watched the Reversing Falls at slack tide, you know the moment I mean. The water hasn’t turned around. It has just stopped rushing. That’s about where our market is.
Each chart below sets a month of 2026 beside the same month of 2025, both as the board first reported them. (Why that matters is in the notes at the bottom, for anyone who enjoys that sort of thing.)
More homes to choose from
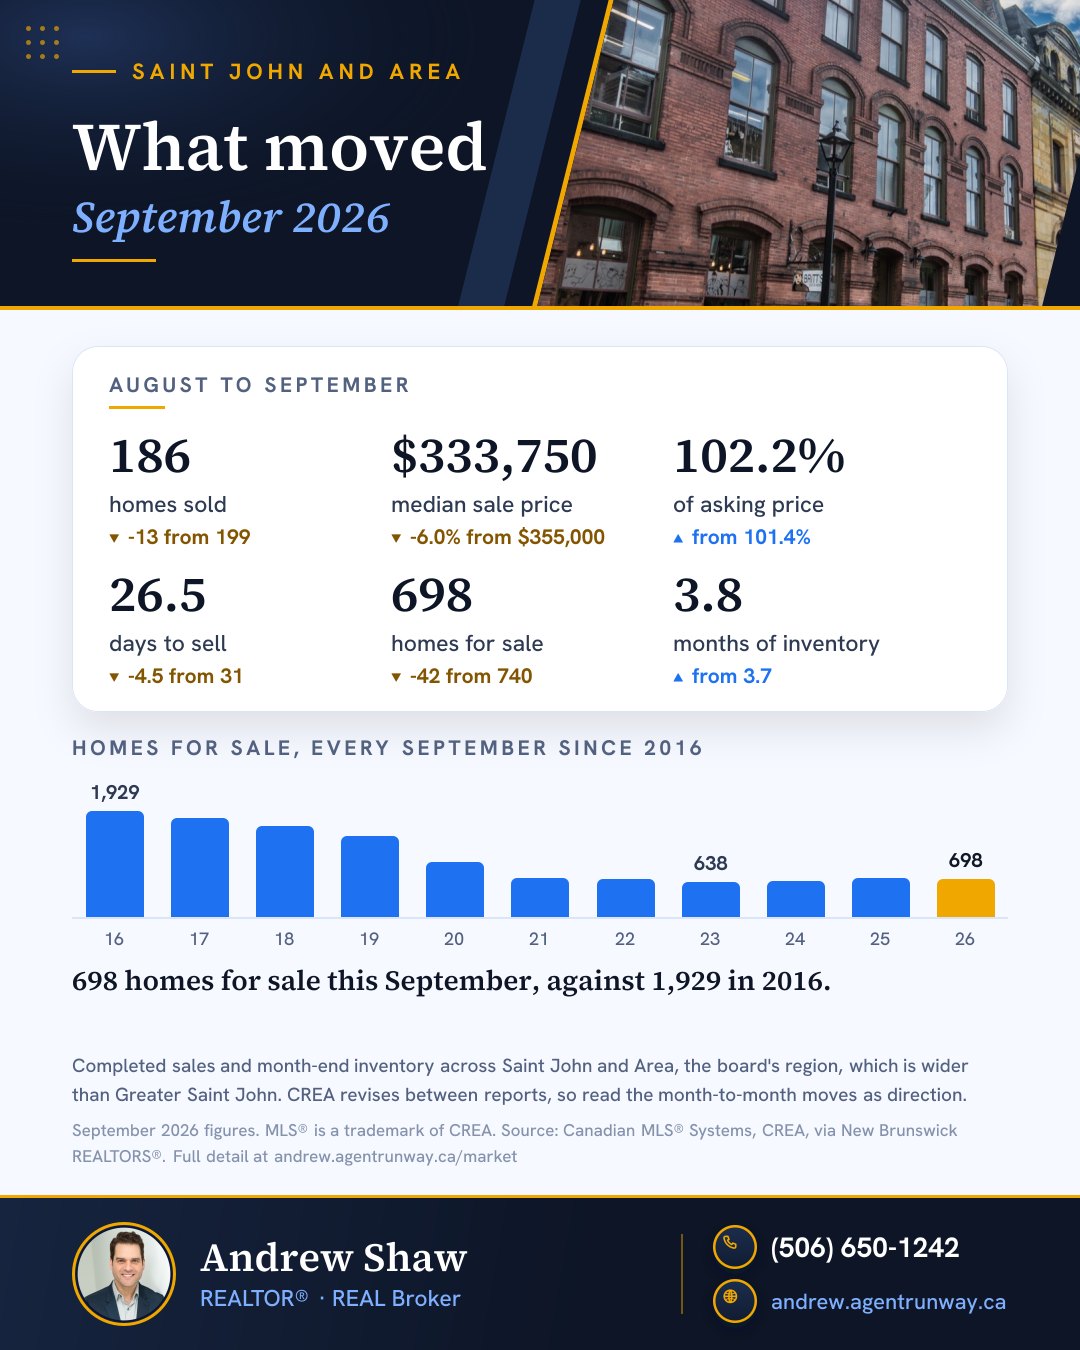
At the end of every month this year, there were more homes for sale than at the same point last year, between 6% and 16% more. In September it was 698, against 659 a year earlier. For a buyer, that is the difference between choosing a house and taking the only one left.
Homes for sale at month end
The numbers
| Month | 2025 | 2026 |
|---|---|---|
| Jan | 383 | 417 |
| Feb | 377 | 438 |
| Mar | 456 | 504 |
| Apr | 533 | 598 |
| May | 603 | 648 |
| Jun | 647 | 724 |
| Jul | 655 | 734 |
| Aug | 651 | 740 |
| Sep | 659 | 698 |
Fewer bidding wars
Homes here still sell for more than their asking price on average, but by less than last year: lower in every month of 2026 so far. The gap was widest in the summer. In August 2025 the typical home went for 106.1% of asking, which on a house listed at $350,000 is about $21,000 over. This August it was 101.4%, or about $5,000 over. Sellers are still winning. They’ve just stopped running up the score.
Sale price as a share of asking price
The numbers
| Month | 2025 | 2026 |
|---|---|---|
| Jan | 100.7% | 99.4% |
| Feb | 105% | 102.3% |
| Mar | 103.9% | 102.9% |
| Apr | 106% | 102.6% |
| May | 106.1% | 104.2% |
| Jun | 107.1% | 104.2% |
| Jul | 106.4% | 102.2% |
| Aug | 106.1% | 101.4% |
| Sep | 104% | 102.2% |
Sales are holding steady
For all the talk of a slowdown, nearly as many homes are changing hands. From January to September, 1,513 sales were first reported this year against 1,563 last year, about 3% fewer. September itself was busier than last year, with 186 sales against 167.
Homes sold each month
The numbers
| Month | 2025 | 2026 |
|---|---|---|
| Jan | 95 | 96 |
| Feb | 129 | 94 |
| Mar | 124 | 122 |
| Apr | 170 | 165 |
| May | 203 | 216 |
| Jun | 218 | 212 |
| Jul | 250 | 223 |
| Aug | 207 | 199 |
| Sep | 167 | 186 |
Edging toward balance
Months of supply is the best single measure of who has the upper hand. It asks a simple question: if nobody listed another home, how many months would it take to sell everything that’s for sale now? Under four months, sellers have the edge. Between four and six is close to balanced.
This summer ran from 3.3 to 3.7 months, against 2.6 to 3.1 last summer. We’re still on the sellers’ side of the line, a few steps closer to it. (The winter months always look balanced, because nobody wants to carry a couch down the front steps in February.)
Months of supply
The numbers
| Month | 2025 | 2026 |
|---|---|---|
| Jan | 4.0 | 4.3 |
| Feb | 2.9 | 4.7 |
| Mar | 3.7 | 4.1 |
| Apr | 3.1 | 3.6 |
| May | 3.0 | 3.0 |
| Jun | 3.0 | 3.4 |
| Jul | 2.6 | 3.3 |
| Aug | 3.1 | 3.7 |
| Sep | 3.9 | 3.8 |
Prices: flat is the new up
Prices haven’t fallen. The benchmark price, the board’s estimate for the same typical home every month (three bedrooms, one bathroom, built in 1984, if you’re curious), climbed through the spring to $364,500 in May 2026. It has eased since and has stayed within $1,000 of $355,000 every month from June. Over the first nine months, the median sale price was $350,000, up 2.9% on the same stretch of 2025.
Benchmark price, January 2025 to September 2026
The numbers
| Jan 2025 | $339K |
| Feb 2025 | $325K |
| Mar 2025 | $330K |
| Apr 2025 | $336K |
| May 2025 | $334K |
| Jun 2025 | $342K |
| Jul 2025 | $340K |
| Aug 2025 | $343K |
| Sep 2025 | $352K |
| Oct 2025 | $351K |
| Nov 2025 | $343K |
| Dec 2025 | $341K |
| Jan 2026 | $339K |
| Feb 2026 | $341K |
| Mar 2026 | $358K |
| Apr 2026 | $362K |
| May 2026 | $365K |
| Jun 2026 | $356K |
| Jul 2026 | $354K |
| Aug 2026 | $356K |
| Sep 2026 | $355K |
What could move prices from here
Where our market goes over the next year depends less on Saint John than on decisions made in Ottawa and Washington. These are the ones worth watching, starting with the one that reaches your mortgage first.
Interest rates: the pause may be ending
The Bank of Canada cut its key rate four times in 2025 and has held it at 2.25% ever since, most recently on September 2. That has been good news for buyers. The catch is inflation. Prices across Canada rose 3.0% over the year to August, mostly because of gasoline; leave gas out and it was 2.4%. When inflation sits above the Bank’s 2% target, the next move tends to be up rather than down.
Economists don’t agree on when. RBC and Desjardins expect the Bank to start raising rates early in 2027. Capital Economics expects a hold at the next meeting but calls it “a close call.” The next two decisions are October 28 and December 9.
Forecasting interest rates is a lot like forecasting fog in Saint John. You can be fairly sure there’ll be some, and anyone who tells you exactly when it lifts is guessing.
Here’s the part that matters right now: fixed mortgage rates don’t wait for the Bank. They follow the bond market, and the five-year Government of Canada yield hit a 52-week high in late September. All six big banks have since raised fixed rates, mostly by between 0.15 and 0.30 percentage points. On a $300,000 mortgage over 25 years, a quarter of a point adds about $42 a month. That won’t sink anybody, but it trims what a buyer can borrow, and it is one more reason the bidding has calmed down.
If your mortgage comes up for renewal in the next year, as many five-year terms signed during the pandemic do, start talking to your lender or a mortgage broker early. Some owners facing a bigger payment will decide to sell, which would add a few more homes to the market.
Tariffs: why New Brunswick feels them more than most
About 90% of New Brunswick’s exports go to the United States, a bigger share than any other province, according to TD Economics. A Canadian Chamber of Commerce study last year ranked Saint John the most tariff-exposed of Canada’s 41 largest cities, partly because of the energy we export. So when trade talks with Washington broke down in August and the US put 50% tariffs on about US$20 billion of Canadian goods, people here paid attention.
The good news is that the direct hit from that list is small. The province estimates it covers $115.1 million of New Brunswick exports, about 0.7% of the total. The Bank of Canada’s governor, speaking in Halifax on September 21, said Atlantic Canada is less exposed to tariffs than Ontario and Quebec.
The less good news is local, and it lands on real people. Moosehead says US tariffs are costing it six figures a month, and a US ban on many Canadian alcoholic drinks was set to start on September 29. The pulp mill in Nackawic will go idle at the end of October, about 350 jobs, with the company pointing to weak markets and coverage pointing to trade instability. UNB economist Herb Emery put it well in July: the tariffs “may not harm the overall economy” but “are going to do significant damage to local communities.”
Tariffs reach house prices mostly through jobs and confidence. Someone unsure about next year’s paycheque tends to put off buying, and a town that loses a big employer sees it in its listings. They also work through rates: tariffs slow the economy but push some prices up, which leaves the Bank of Canada less room to cut. TD expects New Brunswick’s unemployment rate to average 7.2% this year and home prices across the province to rise 0.4% in 2026 and 1.8% in 2027. That is a drag, not a cliff.
Population: still growing here
Ottawa has been cutting the number of temporary residents across the country, which takes some pressure off rents and starter homes. New Brunswick has so far bucked that. Statistics Canada counted 883,522 people in the province on July 1, up 0.6% in a single quarter, and our number of temporary residents rose 6.2% while it fell nationally. The next federal immigration plan is due before November 1, and it’s worth watching: people moving here are one reason our housing has stayed tight.
Closer to home
The province is keeping its 3% cap on rent increases through 2027, and a rewrite of the Residential Tenancies Act is expected this fall. Both matter to anyone buying a home with a rental unit, because they set what that unit can earn. The province has also tabled changes to how property taxes are set, starting with the 2027 tax year. For what that means for a particular home, the province’s own explanation is the place to start; I’ll leave the details to them.
My read
I expect the drift toward balance to carry on through the winter, a little faster if fixed rates keep climbing. I don’t expect prices to fall much while homes still sell in under a month for more than their asking price. What I do expect is that sellers who price like it’s 2025 will wait longer, and buyers who are ready will have a better winter than they’ve had in a while.
Sources for this section
- Bank of Canada, rate announcement, 2 September 2026
- Statistics Canada, Consumer Price Index, August 2026
- BNN Bloomberg, odds of a rate hike this year, 18 September 2026
- Canadian Mortgage Trends, banks raise fixed rates, 29 September 2026
- TD Economics, provincial economic forecast, 21 September 2026
- Canadian Chamber of Commerce, tariff-vulnerable cities, 11 February 2025
- PBS NewsHour, the 50% tariffs on Canadian goods, 22 August 2026
- Government of New Brunswick, tariff response, 10 September 2026
- CP24, Moosehead and the US alcohol ban, 9 September 2026
- National Newswatch, the Nackawic mill, 18 September 2026
- Global News, Herb Emery on tariffs, 28 July 2026
- CP24, Tiff Macklem in Halifax, 21 September 2026
- Statistics Canada, population estimates, 23 September 2026
- Government of New Brunswick, rent cap kept for 2027, 24 June 2026
- Government of New Brunswick, proposed property tax reforms, 27 May 2026
So what does this mean for you?
If you’re selling, price for the market we’re in, not the one from last summer. Homes took a median of 31 days to sell this August against 23 a year earlier. A well-priced house still goes quickly and still often goes over asking. An optimistic one now has company on the street, and buyers have time to compare.
If you’re buying, you have more to choose from than a year ago and a better chance of buying without a bidding war. A good house at the right price will still draw a crowd, so get your financing sorted before you fall in love with one.
Either way, the averages only go so far. If you want to know what this means for your street or your price range, get in touch or call me at (506) 650-1242.