
For owners in Saint John, Rothesay, Quispamsis and Hampton
What is my home worth? Start with the real numbers.
Most valuation pages ask for your details and tell you nothing. This one goes the other way. Look up your address, see what the province has it assessed at, and see what homes at that assessment have actually been selling for. Then decide whether you want the proper version.
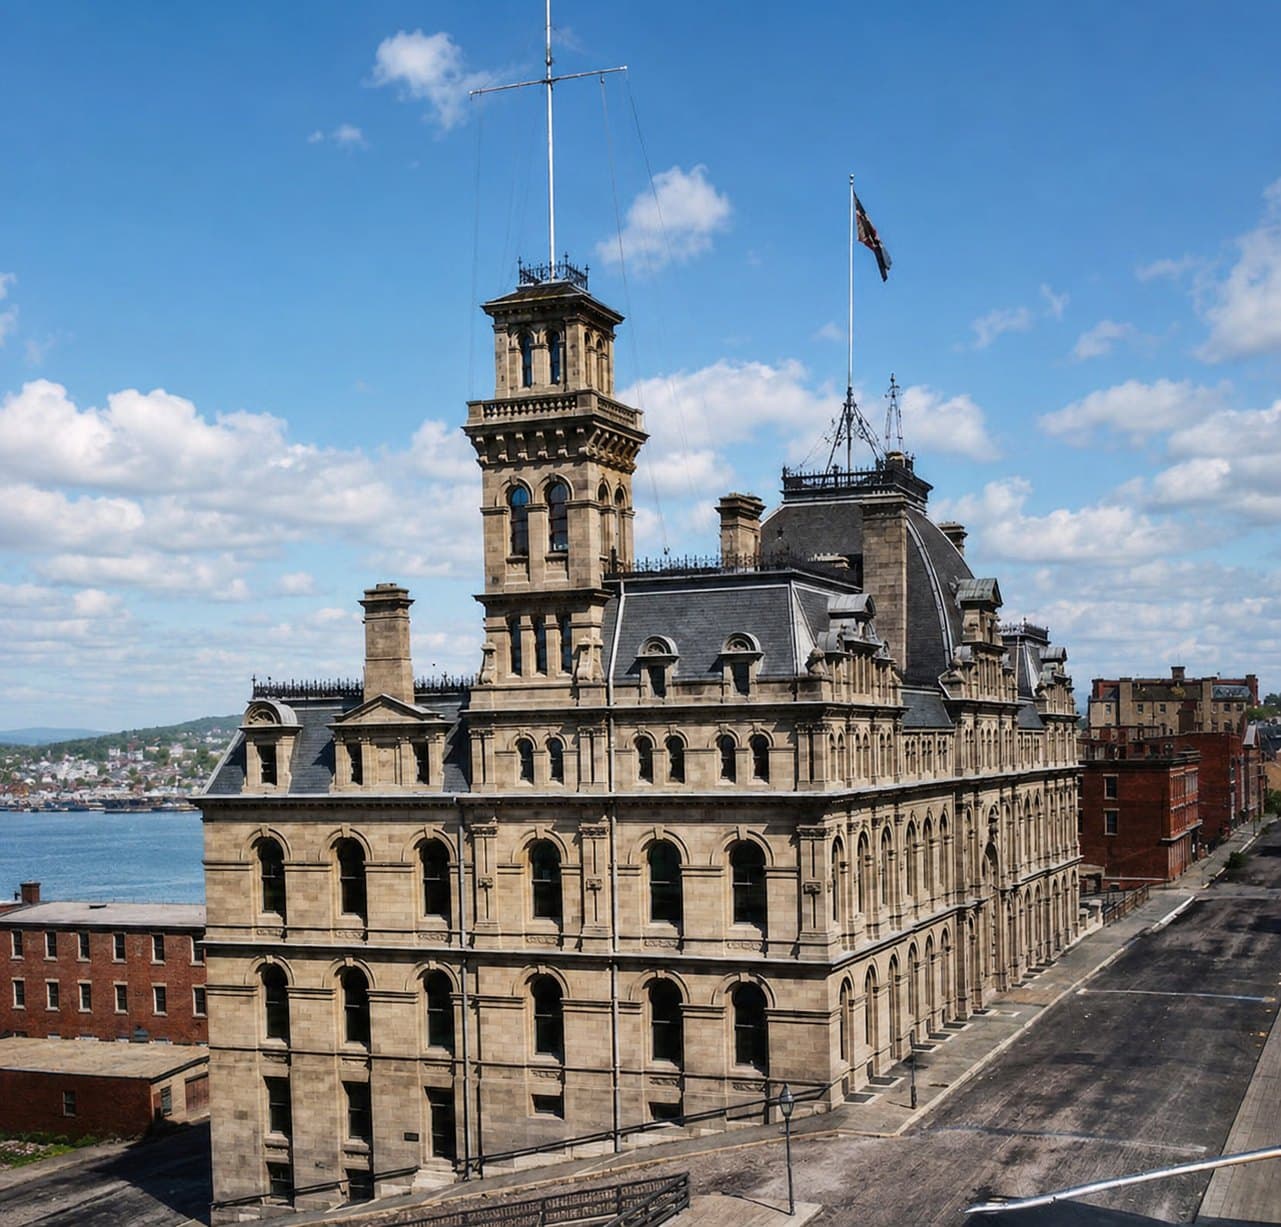
The Custom House · Prince William Street, demolished 1960
What homes like yours are asking
Right now, on the market.
$330,000
Median asking
$277,000 to $456,000
The middle half
55
For sale in Saint John, 3 bedrooms
Asking prices of homes listed on MLS® as of October 10, not what anything sold for. A proper valuation weighs your street, your condition and what actually closed; that is the form below.
See these homesThen see what you’d walk away with at that price
What that assessment is worth in the real market
Your assessment is not your price.
It is set for taxation and it lags the market. Across 2,952 home sales in this area since January 2025, the median came in 17.0% above the assessed value.
A home assessed at $300,000
$313,000
lower quartile
$351,000
median sale
$397,000
upper quartile
That middle band is $84,000 wide, and it only covers half of all sales. A quarter came in below it and a quarter above. Which is the honest reason a number off a website cannot price your house: the spread between two homes with the same assessment is decided by condition, kitchens, roofs, and what the back of the property looks at.
| Community | Sales | Median | Middle half |
|---|---|---|---|
| Fundy-St. Martins | 132 | +43.3% | +15.7% to +74.6% |
| Rothesay | 311 | +17.7% | +6.2% to +31.2% |
| Grand Bay-Westfield | 136 | +17.3% | +3.5% to +34.6% |
| Quispamsis | 547 | +16.8% | +6.5% to +30.0% |
| Saint John | 1548 | +16.3% | +3.3% to +31.3% |
| Hampton | 278 | +14.4% | +2.6% to +32.5% |
Home sales only, with sale prices and assessed values from Service New Brunswick property data, published as provincial open data. Transfers of other property, from apartment blocks to vacant land, are not counted, and a home sold with the lot beside it is measured against both assessments. Transfers far outside market range are excluded as family transfers and bulk deals. This describes what sale prices did relative to assessments. It is not an appraisal, it says nothing about whether any assessment is correct, and it is not tax advice.
And what selling looks like right now.
102.2%
of asking price
homes sold above list in September 2026
26.5 days
to sell
median, against 23 a year ago
$333,750
median sale price
-4.6% on a year ago
+46.4%
over five years
the same house, by the price index
Saint John and Area figures from New Brunswick REALTORS®, reported a month behind. More on Market Pulse, and the whole process on the seller’s guide.
The proper version
Now the part a website cannot do.
I will walk the house, pull the comparable sales that actually match it rather than the ones that share a postcode, and give you a number with the reasoning attached. If I think you should wait, or spend two thousand dollars before listing, or not sell at all, I will say that too.
- Comparable sales that match your home, with the adjustments shown
- What to fix, what to leave, and what will not return its cost
- A pricing strategy for this market rather than last year's
- No obligation, and no pressure to list