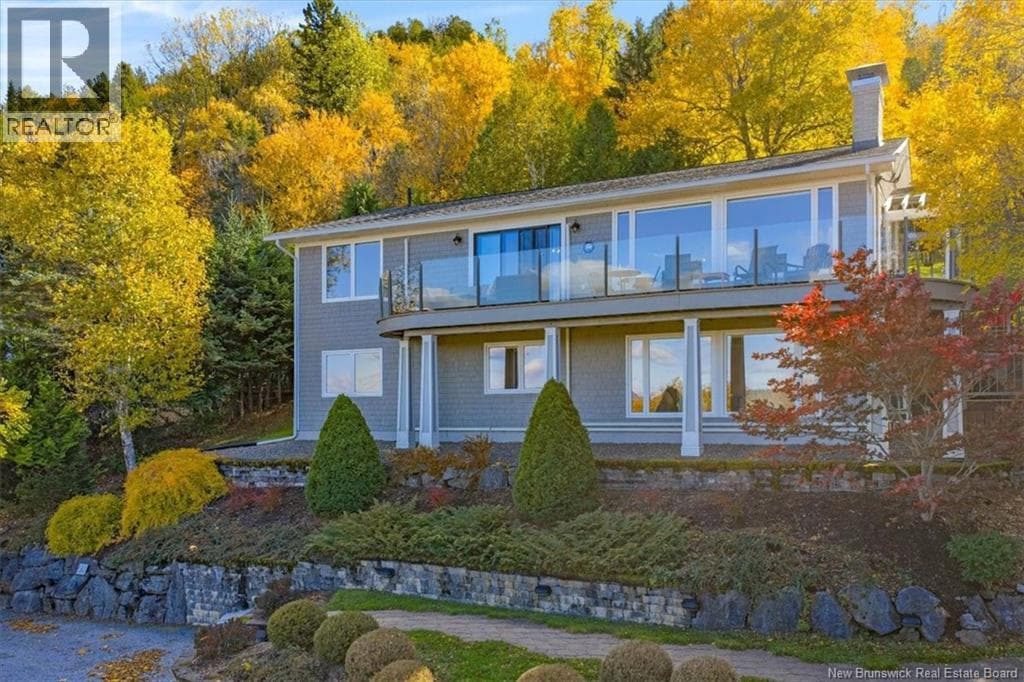
 Single Family
$799,900
50 Beach Road
Saint John, New Brunswick
3 bed2 bath2,831 square feet
Listed by EXIT Realty Specialists
Cedar Point to the ferry

I’m Andrew Shaw, a REALTOR® with The Ellis Team at REAL Broker. I grew up in Cedar Point, and my parents still live there. This page follows the houses from Ragged Point out to the ferry landing: which ones are for sale today, and what every one that changed hands this past year sold for.

Neighbourhood boundaries: City of Saint John open data, Open Government Licence.
For sale today
Every brokerage’s listing, each with who listed it, newest first.
Single Family$799,900
50 Beach Road
Saint John, New Brunswick
3 bed2 bath2,831 square feet
Listed by EXIT Realty Specialists
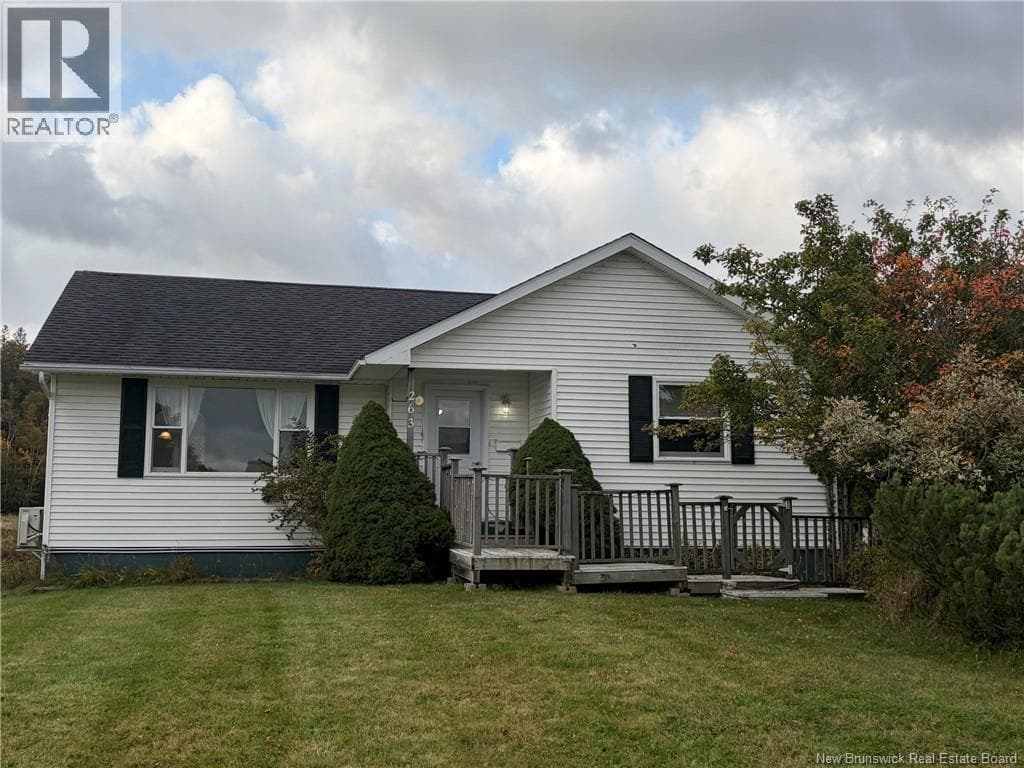 Single Family
$349,900
263 Boars Head Road
Saint John, New Brunswick
4 bed2 bath2,111 square feet
Listed by Royal LePage Atlantic
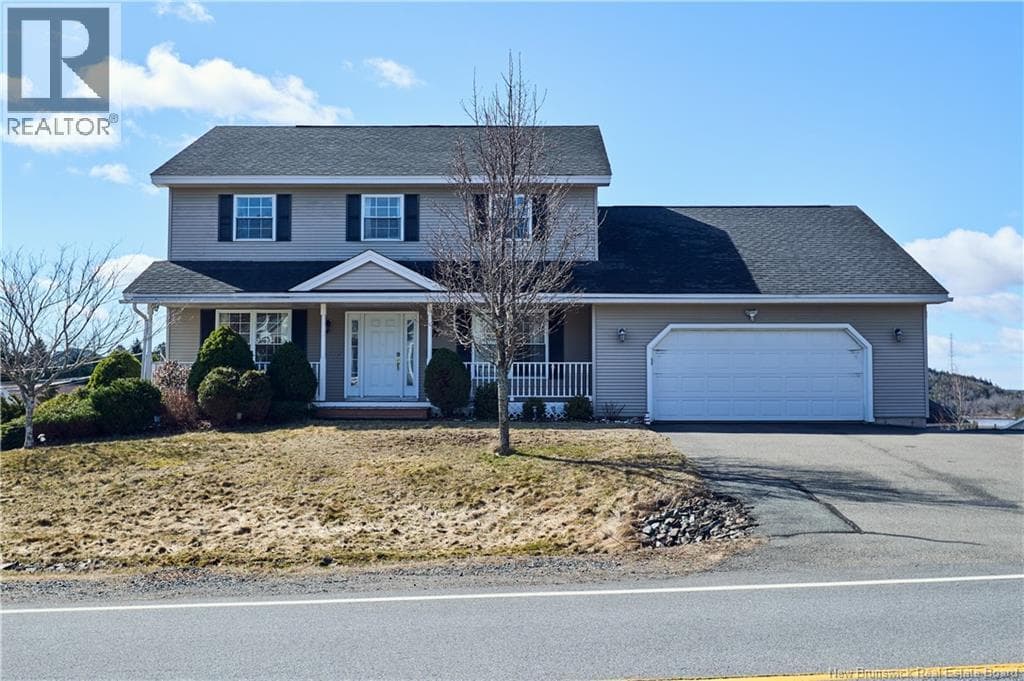 Single Family
$729,900
77 Cedarwood Drive
Saint John, New Brunswick
7 bed4 bath3,656 square feet
Listed by EXIT Realty Specialists
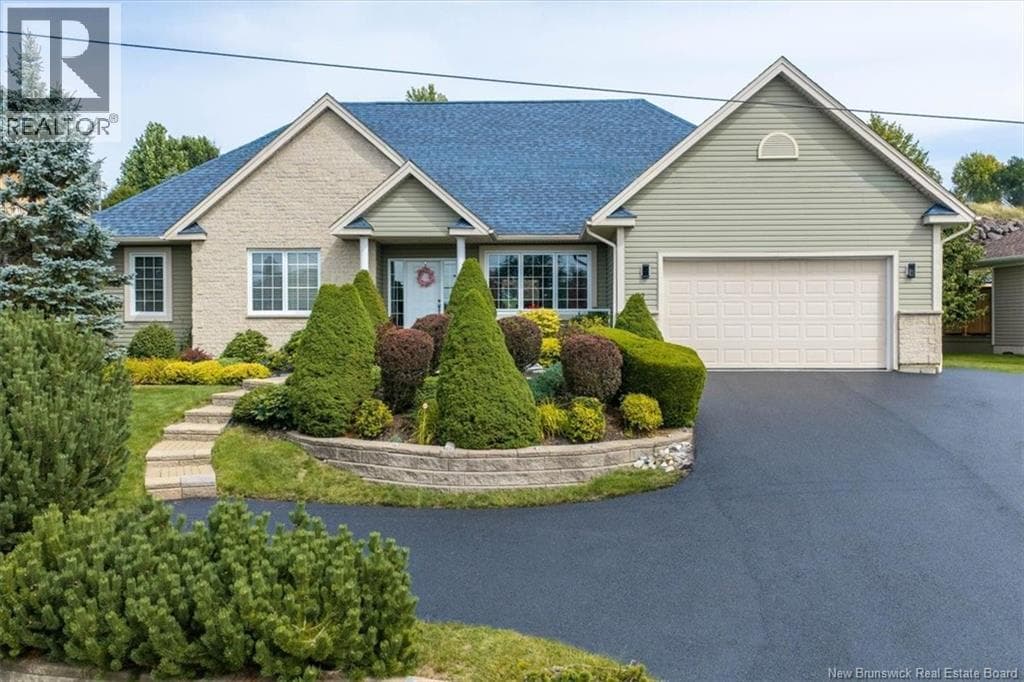 Single Family
$674,900
40 Anchorage Avenue
Saint John, New Brunswick
4 bed4 bath4,000 square feet
Listed by Keller Williams Capital Realty
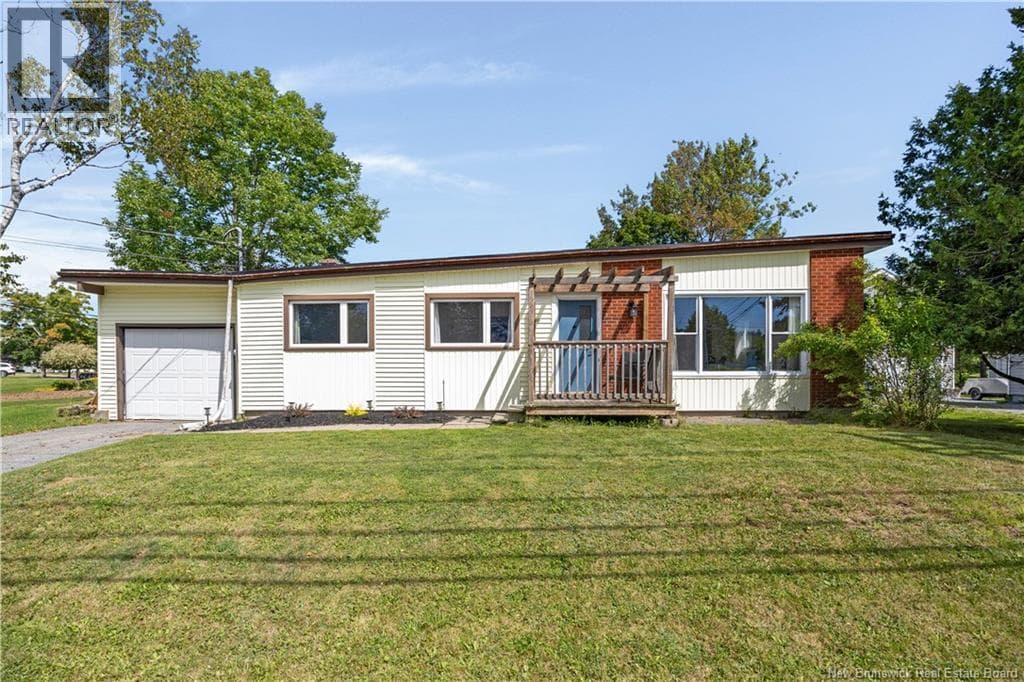 Single Family
$299,900
96 Woodward Avenue
Saint John, New Brunswick
3 bed1 bath995 square feet
Listed by EXIT Realty Specialists
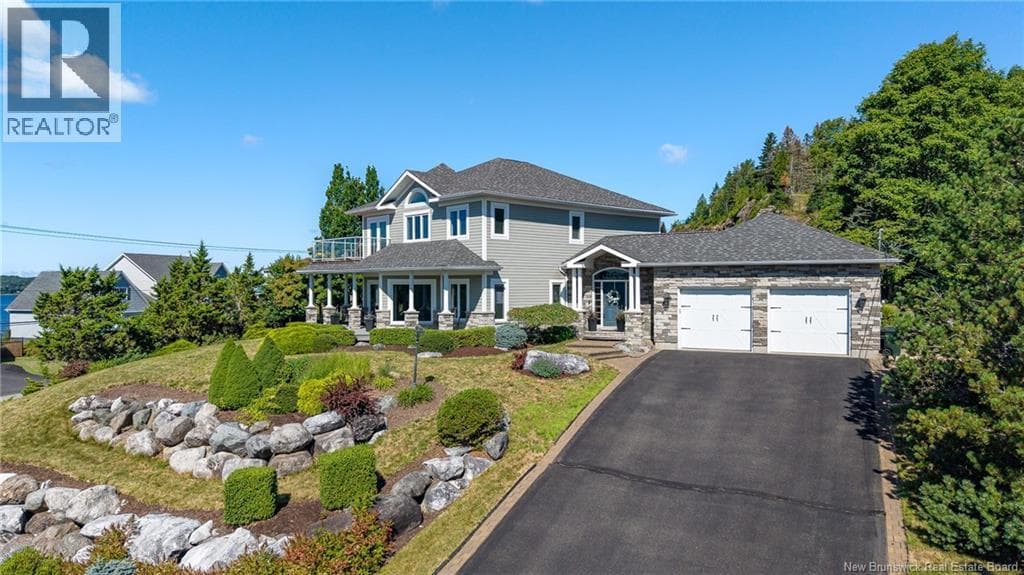 Single Family
$799,900
5 Admiralty Drive
Saint John, New Brunswick
3 bed4 bath3,948 square feet
Listed by RE/MAX Professionals
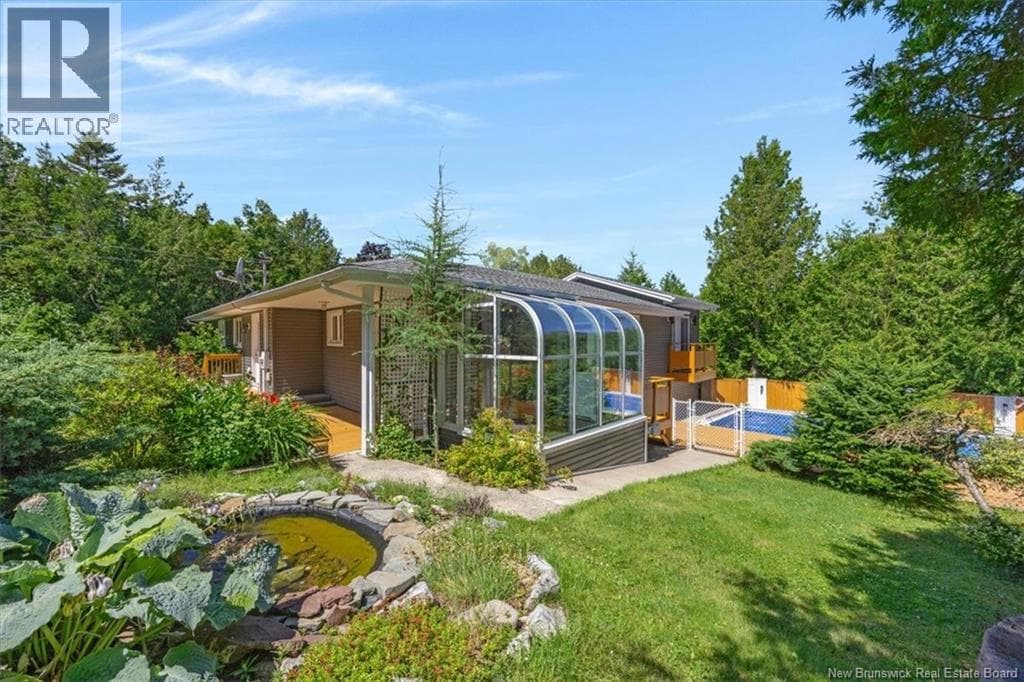 Single Family
$599,900
100 Kennebecasis Drive
Saint John, New Brunswick
4 bed3 bath2,281 square feet
Listed by Royal LePage Select Realty
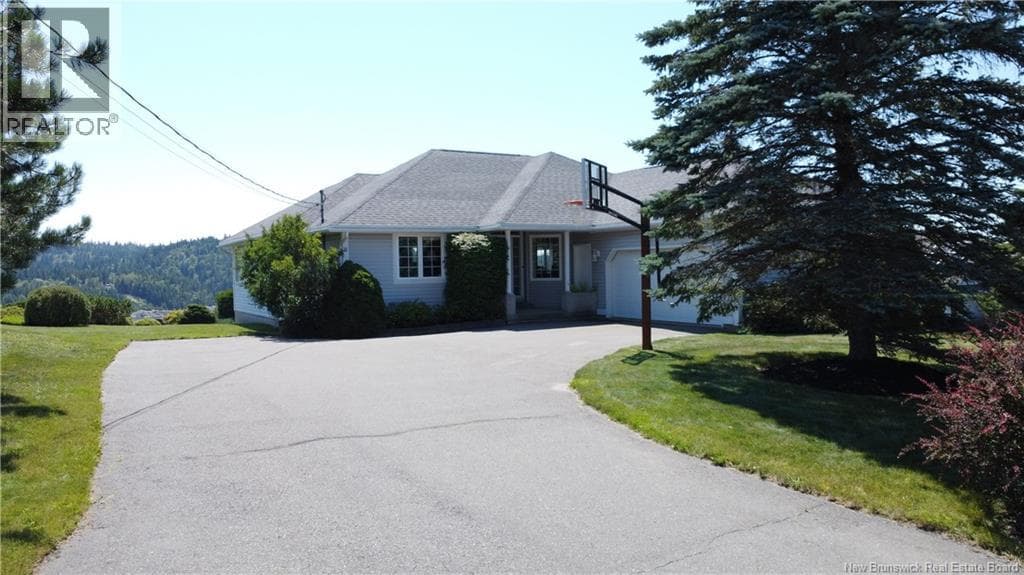 Single Family
$975,000
91 Rivershore Drive
Saint John, New Brunswick
5 bed3 bath3,300 square feet
Listed by Royal LePage Atlantic
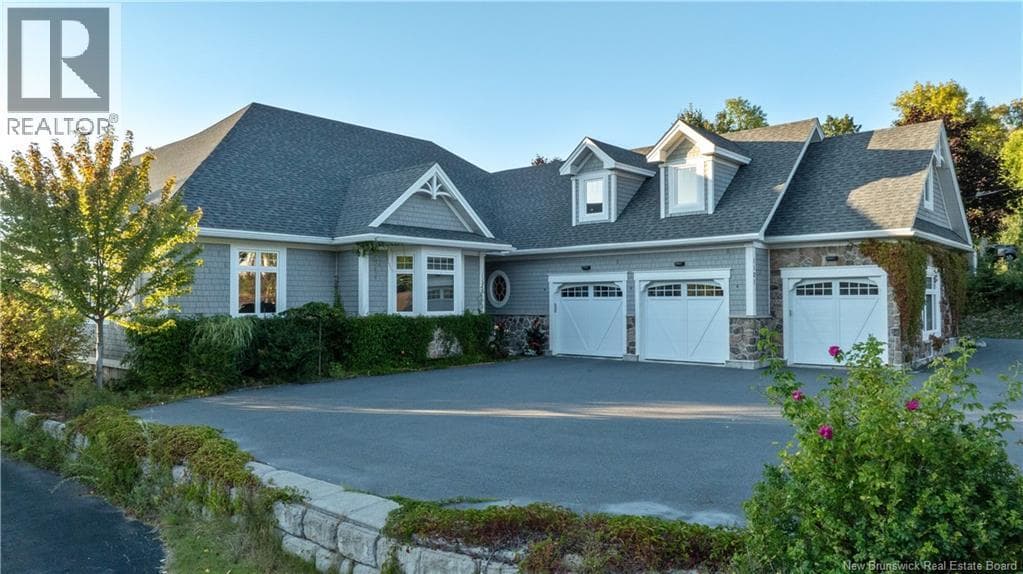 Single Family
$1,325,000
1121 Kennebecasis Drive
Saint John, New Brunswick
3 bed3 bath3,500 square feet
Listed by EXIT Realty Specialists
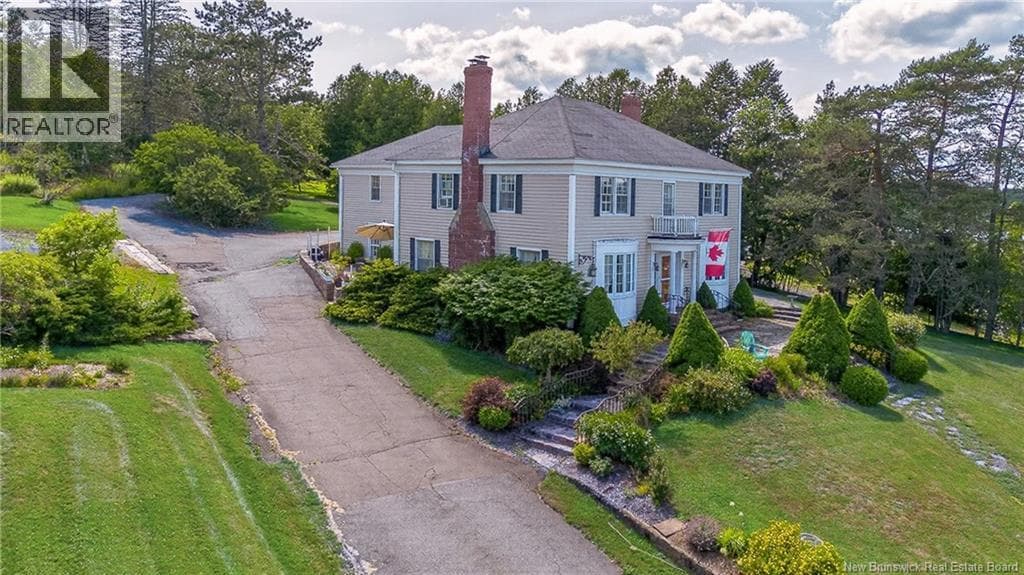 Single Family
$900,000
154 Manners Sutton Road
Saint John, New Brunswick
5 bed4 bath4,690 square feet
Listed by RE/MAX Professionals
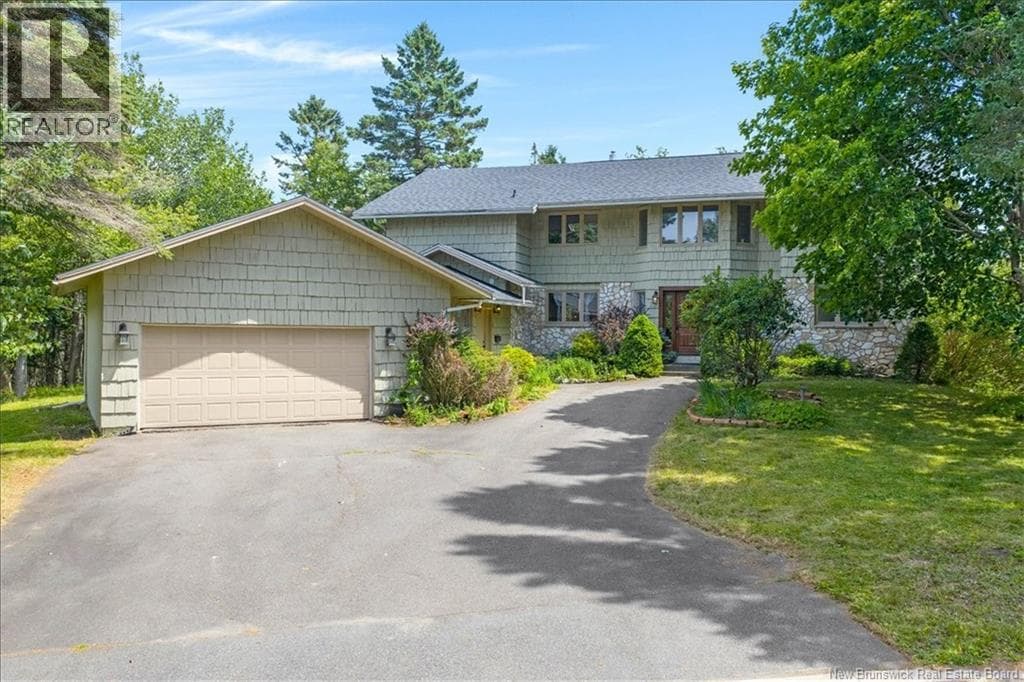 Single Family
$599,900
35 Marlin Terrace
Saint John, New Brunswick
5 bed3 bath4,155 square feet
Listed by RE/MAX Professionals
What sold
These are the prices registered with the province when each house changed hands, which runs about a month behind, set beside the province’s assessment at the time and the size of the lot from its own outline. A transfer far from its assessment, between family for instance, is left out of the list and the figures alike. A median describes the street, not any one house on it.
| Number on the drawing | Address | Recorded | Lot | Assessed | Sold for | Against assessment |
|---|---|---|---|---|---|---|
| 1 | 330 Woodward Ave | September 2026 | 0.07 ac | $301,600 | $375,500 | +24.5% |
| 2 | 110 Anchorage Ave | September 2026 | 0.4 ac | $663,300 | $700,000 | +5.5% |
| 3 | 1117 Kennebecasis Dr | September 2026 | 0.6 ac | $625,100 | $850,000 | +36% |
| 4 | 3 Ray St | September 2026 | 0.2 ac | $275,000 | $407,500 | +48.2% |
| 5 | 59 Tudor Ln | September 2026 | 0.09 ac | $405,800 | $400,000 | -1.4% |
| 6 | 167 Meadowbank Ave | August 2026 | 0.2 ac | $513,500 | $435,000 | -15.3% |
| 7 | 84 Anchorage Ave | August 2026 | 0.3 ac | $924,900 | $750,000 | -18.9% |
| 8 | 90 Westminster Crt | August 2026 | 0.2 ac | $488,000 | $550,000 | +12.7% |
| 9 | 233 Boars Head Rd | August 2026 | 0.2 ac | $339,900 | $420,000 | +23.6% |
| 10 | 71 Anchorage Ave | August 2026 | 0.4 ac | $1,076,000 | $1,050,000 | -2.4% |
| 11 | 9 Hayward Crt | August 2026 | 0.1 ac | $225,600 | $350,000 | +55.1% |
| 12 | 69 Cambridge Drive | August 2026 | 0.2 ac | $67,500 | $118,000 | +74.8% |
| 13 | 382 Boars Head Rd | August 2026 | 0.1 ac | $277,100 | $355,000 | +28.1% |
| 14 | 635 Woodward Av | August 2026 | 1 ac | $615,700 | $775,000 | +25.9% |
| 15 | 9 Marlin Terr | August 2026 | 0.2 ac | $429,600 | $465,000 | +8.2% |
| 16 | 326 Woodward Ave | August 2026 | 0.1 ac | $298,600 | $385,000 | +28.9% |
| 17 | 38 Secoudon Dr | August 2026 | 0.3 ac | $522,800 | $585,000 | +11.9% |
| 18 | 42 Crown Hill Cres | August 2026 | 0.3 ac | $566,200 | $565,000 | -0.2% |
| 19 | 20 Cedarwood Dr | August 2026 | 0.4 ac | $431,000 | $560,000 | +29.9% |
| 20 | 1000 Kennebecasis Dr | August 2026 | 0.2 ac | $483,700 | $475,000 | -1.8% |
| 21 | 105 Boars Head Rd | July 2026 | 0.1 ac | $395,100 | $400,000 | +1.2% |
| 22 | 49 High Ridge Rd | July 2026 | 0.2 ac | $562,100 | $325,000 | -42.2% |
| 23 | 170 Kennebecasis Dr | July 2026 | 0.3 ac | $328,700 | $374,000 | +13.8% |
| 24 | 223 Ragged Point Rd | July 2026 | 1.7 ac | $449,400 | $605,000 | +34.6% |
| 25 | 311 Boars Head Rd | July 2026 | 0.08 ac | $267,000 | $337,500 | +26.4% |
| 26 | 12 Grant Cres | July 2026 | 0.4 ac | $325,600 | $425,000 | +30.5% |
| 27 | 1236 Kennebecasis Dr | July 2026 | 0.2 ac | $271,900 | $450,000 | +65.5% |
| 28 | 147 Woodhaven Dr | July 2026 | 0.06 ac | $252,600 | $298,000 | +18% |
| 29 | 10 Noel Ave | July 2026 | 0.06 ac | $232,800 | $310,000 | +33.2% |
| 30 | 102 Manners Sutton Rd | July 2026 | 0.3 ac | $291,600 | $377,000 | +29.3% |
| 31 | 315 Boars Head Rd | July 2026 | 0.2 ac | $307,200 | $452,000 | +47.1% |
| 32 | 70 Alward St | July 2026 | 0.1 ac | $273,200 | $370,000 | +35.4% |
| 33 | 80 Westmount Dr | July 2026 | 0.7 ac | $569,700 | $625,000 | +9.7% |
| 34 | 102 Cedarwood Dr | June 2026 | 0.4 ac | $616,200 | $695,000 | +12.8% |
| 35 | 105 Cedarwood Dr | June 2026 | 0.5 ac | $804,600 | $870,000 | +8.1% |
| 36 | 31 Blanchard Lane | June 2026 | 0.4 ac | $577,900 | $640,000 | +10.7% |
| 37 | 20 Brigadoon Terr | June 2026 | 0.4 ac | $737,700 | $665,000 | -9.9% |
| 38 | 1910 Sandy Point Rd | June 2026 | 0.8 ac | $267,200 | $345,000 | +29.1% |
| 39 | 352 Boars Head Rd | June 2026 | 0.09 ac | $299,600 | $376,000 | +25.5% |
| 40 | 9 Whitetail Lane | June 2026 | 0.4 ac | $512,500 | $560,000 | +9.3% |
| 41 | 16 Amelia Crt | June 2026 | 0.2 ac | $487,800 | $541,500 | +11% |
| 42 | 560 Woodward Ave | June 2026 | 0.2 ac | $463,100 | $380,000 | -17.9% |
| 43 | 72 Manners Sutton Rd | June 2026 | 0.1 ac | $456,000 | $510,000 | +11.8% |
| 44 | 92 Brentwood Cres | June 2026 | 0.09 ac | $350,500 | $335,000 | -4.4% |
| 45 | 314 Woodward Ave | June 2026 | 0.07 ac | $302,000 | $342,000 | +13.2% |
| 46 | 169 Manners Sutton Rd | June 2026 | 0.2 ac | $450,500 | $520,000 | +15.4% |
| 47 | 50 Brigadoon Terr | June 2026 | 0.4 ac | $762,000 | $737,000 | -3.3% |
| 48 | 158 Manners Sutton Rd | June 2026 | 0.4 ac | $433,100 | $520,000 | +20.1% |
| 49 | 211 Boars Head Rd | June 2026 | 0.2 ac | $329,600 | $400,000 | +21.4% |
| 50 | 30 Secoudon Dr | June 2026 | 0.4 ac | $391,000 | $550,000 | +40.7% |
| 51 | 8 Blanchard Lane | May 2026 | 0.4 ac | $569,900 | $615,000 | +7.9% |
| 52 | 88 Anchorage Ave | May 2026 | 0.3 ac | $750,600 | $794,000 | +5.8% |
| 53 | 1240 Kennebecasis Dr | April 2026 | 0.2 ac | $328,400 | $390,000 | +18.8% |
| 54 | 20 Fieldstone Dr | April 2026 | 0.2 ac | $727,500 | $735,000 | +1% |
| 55 | 24 Anchorage Ave | March 2026 | 0.4 ac | $699,100 | $750,000 | +7.3% |
| 56 | 10 Wasson Crt | March 2026 | 0.03 ac | $264,400 | $280,000 | +5.9% |
| 57 | 37 Leeds Cr | March 2026 | 0.2 ac | $497,900 | $590,000 | +18.5% |
| 58 | 73 Alward St | March 2026 | 0.2 ac | $261,500 | $372,000 | +42.3% |
| 59 | 309 Boars Head Rd | March 2026 | 0.08 ac | $344,200 | $385,000 | +11.9% |
| 60 | 53 Hill Heights Rd | March 2026 | 0.5 ac | $437,100 | $515,000 | +17.8% |
| 61 | 26 Crown Hill Cres | March 2026 | 0.2 ac | $556,200 | $635,000 | +14.2% |
| 62 | 100 Meadowbank Ave | March 2026 | 0.5 ac | $358,400 | $530,000 | +47.9% |
| 63 | 42 Cambridge Dr | February 2026 | 0.1 ac | $386,100 | $342,000 | -11.4% |
| 64 | 953 Millidge Ave | February 2026 | 0.1 ac | $234,800 | $310,000 | +32% |
| 65 | 131 Marlin Dr | January 2026 | 0.2 ac | $499,000 | $575,000 | +15.2% |
| 66 | 1005 Kennebecasis Dr | January 2026 | 0.7 ac | $654,500 | $830,000 | +26.8% |
| 67 | 1820 Sandy Point Rd | January 2026 | 0.5 ac | $419,600 | $485,000 | +15.6% |
| 68 | 16 Bullock St | January 2026 | 0.2 ac | $413,600 | $432,500 | +4.6% |
| 69 | 845 Millidge Ave | January 2026 | 0.3 ac | $224,900 | $200,000 | -11.1% |
| 70 | 185 Kennebecasis Dr | December 2025 | 0.3 ac | $301,400 | $325,000 | +7.8% |
| 71 | 1104 Kennebecasis Dr | December 2025 | 0.2 ac | $279,300 | $362,000 | +29.6% |
| 72 | 150 Donaldson St | December 2025 | 0.1 ac | $268,600 | $300,000 | +11.7% |
| 73 | 75 Crown Hill Cres | December 2025 | 0.5 ac | $494,300 | $640,000 | +29.5% |
| 74 | 509 Boars Head Rd | December 2025 | 0.3 ac | $272,500 | $375,000 | +37.6% |
| 75 | 146 Woodhaven Dr | November 2025 | 0.08 ac | $225,300 | $284,000 | +26.1% |
| 76 | 34 Westminster Crt | November 2025 | 0.2 ac | $442,000 | $484,000 | +9.5% |
| 77 | 80 Brentwood Cres | November 2025 | 0.05 ac | $296,200 | $340,000 | +14.8% |
| 78 | 400 Woodward Ave | November 2025 | 0.3 ac | $372,200 | $525,000 | +41.1% |
| 79 | 966 Millidge Ave | November 2025 | 0.1 ac | $428,800 | $434,000 | +1.2% |
| 80 | 4 Ray St | November 2025 | 0.2 ac | $275,300 | $359,000 | +30.4% |
| 81 | 88 Black St | November 2025 | 0.2 ac | $279,300 | $279,000 | -0.1% |
| 82 | Ragged Point Rd | November 2025 | 0.3 ac | $55,200 | $55,000 | -0.4% |
| 83 | 32 Macauley Ave | November 2025 | 0.06 ac | $296,900 | $385,000 | +29.7% |
| 84 | 315 Pelton Rd | October 2025 | 0.7 ac | $625,700 | $555,000 | -11.3% |
| 85 | 74 Tudor Lane | October 2025 | 0.09 ac | $470,300 | $462,500 | -1.7% |
| 86 | 97 Manners Sutton Rd | October 2025 | 0.3 ac | $525,000 | $560,000 | +6.7% |
| 87 | 247 Bedell Ave | October 2025 | 0.2 ac | $394,900 | $478,000 | +21% |
| 88 | 641 Woodward Ave | October 2025 | 0.09 ac | $345,200 | $355,000 | +2.8% |
| 89 | 5 Wasson Crt | October 2025 | 0.03 ac | $301,700 | $137,050 | -54.6% |
| 90 | 210 Bedell Ave | October 2025 | 0.5 ac | $828,700 | $820,000 | -1% |
| 91 | 531 Millidge Ave | October 2025 | 0.3 ac | $344,800 | $370,000 | +7.3% |
| 92 | 277 Boars Head Rd | October 2025 | 0.08 ac | $354,600 | $435,000 | +22.7% |
| 93 | 81 Tudor Ln | October 2025 | 0.1 ac | $406,000 | $500,000 | +23.2% |
Recorded transfers from the province, not MLS® sales. They say nothing about whether any assessment is correct, and they are not an appraisal. Contains information licensed under the Open Government Licence – New Brunswick.
Street by street
The line runs from Ragged Point and Cedar Point across Millidge Avenue to the Millidgeville streets by the marina, then out Kennebecasis Drive to the houses around the ferry landing. The Boar’s Head woods and the university’s land sit outside it. Here are the houses on each street, and how many of them changed hands since October 2025.
Across Saint John
Source: Canadian MLS® Systems, CREA. Saint John and Area MLS® Residential Market Activity report, published by New Brunswick REALTORS®.
Your own street
If you live inside the line, I’ll send you a report around the tenth of each month. It opens with this year’s sales and the newest of them, then turns to your own street.
It never puts a price on your house. A real number for one house takes walking through it, and I’m glad to do that whenever you ask. Every report has a link to stop it.

Andrew Shaw
REALTOR® · The Ellis Team at REAL Broker
Wondering what your own house would bring, or when the timing is right? Call or text me any time.
The line is drawn from the City of Saint John’s own planning areas: Cedar Point, Millidgeville and Kennebecasis Bay. The Millidgeville guide covers schools, getting around and the wider market.