By Andrew Shaw, REALTOR® with REAL Broker · November 3, 2026
October in a nutshell
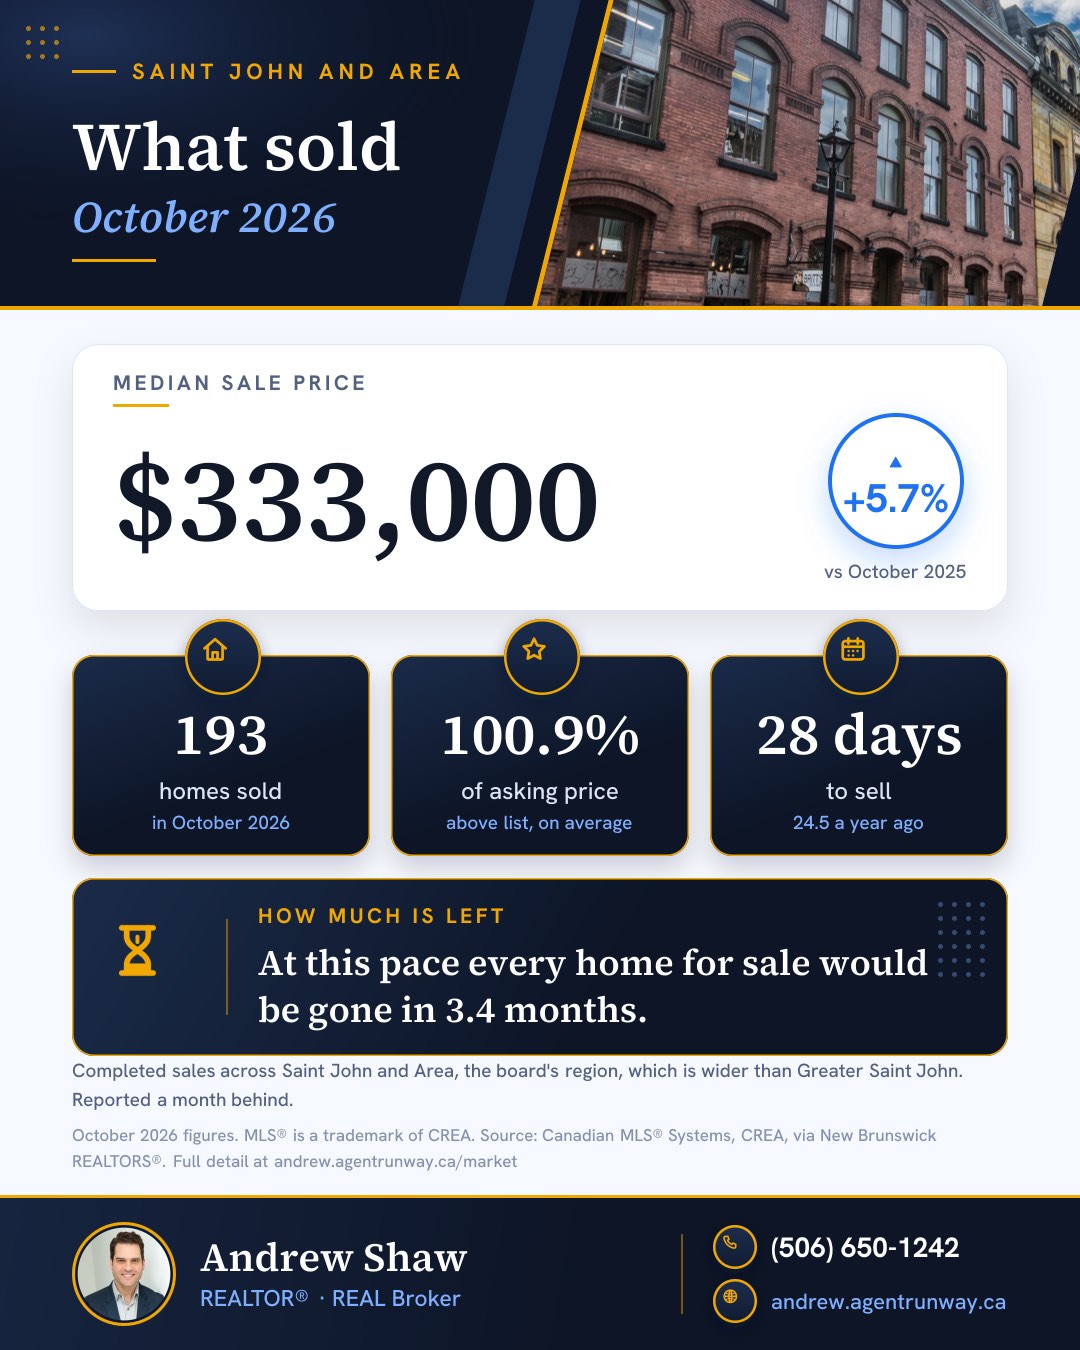
193
homes sold
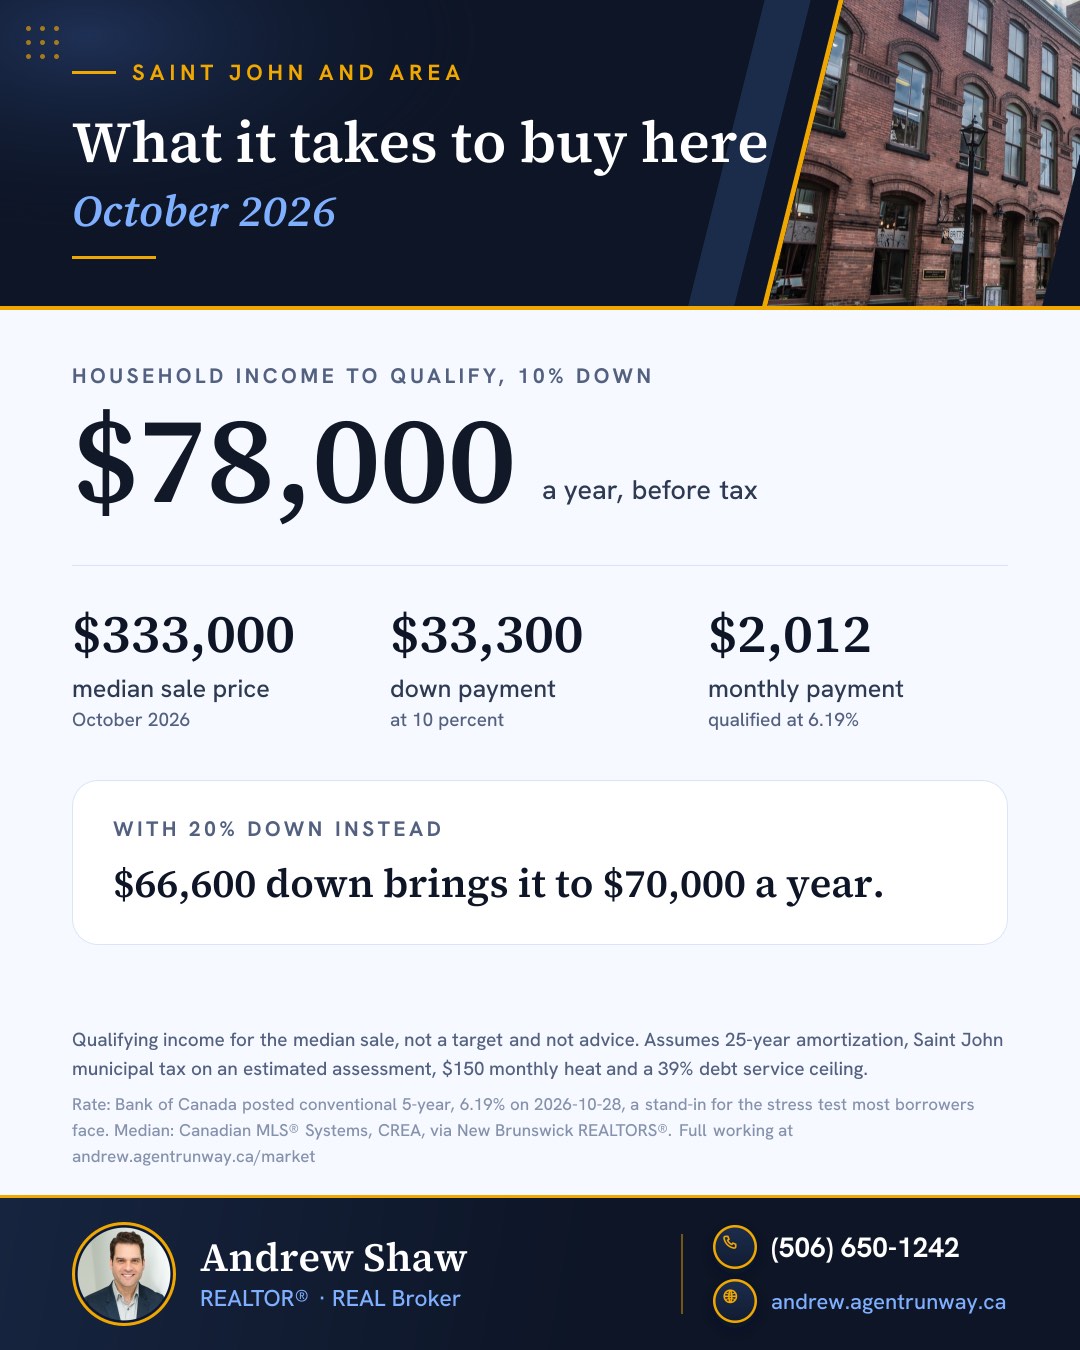
$333,000
median sale price
100.9%
of asking, on average
28
days to sell
The figure I’d look at first is the sale price as a share of the asking price. On a house listed at $350,000, last October’s average works out to about $16,000 over asking. This October’s works out to about $3,000 over.
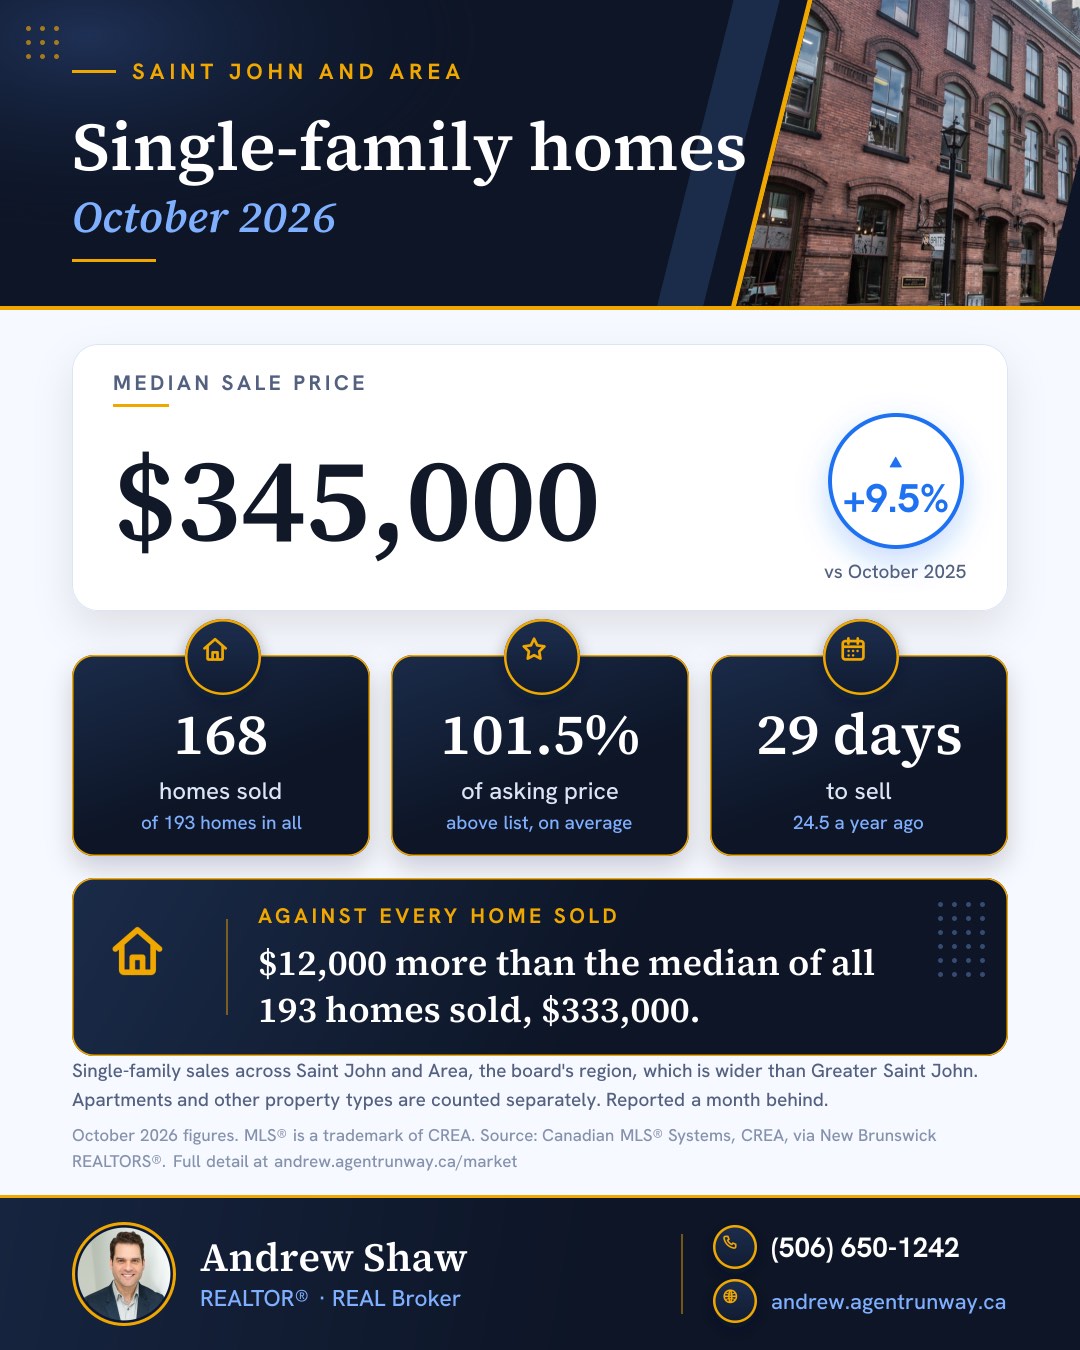
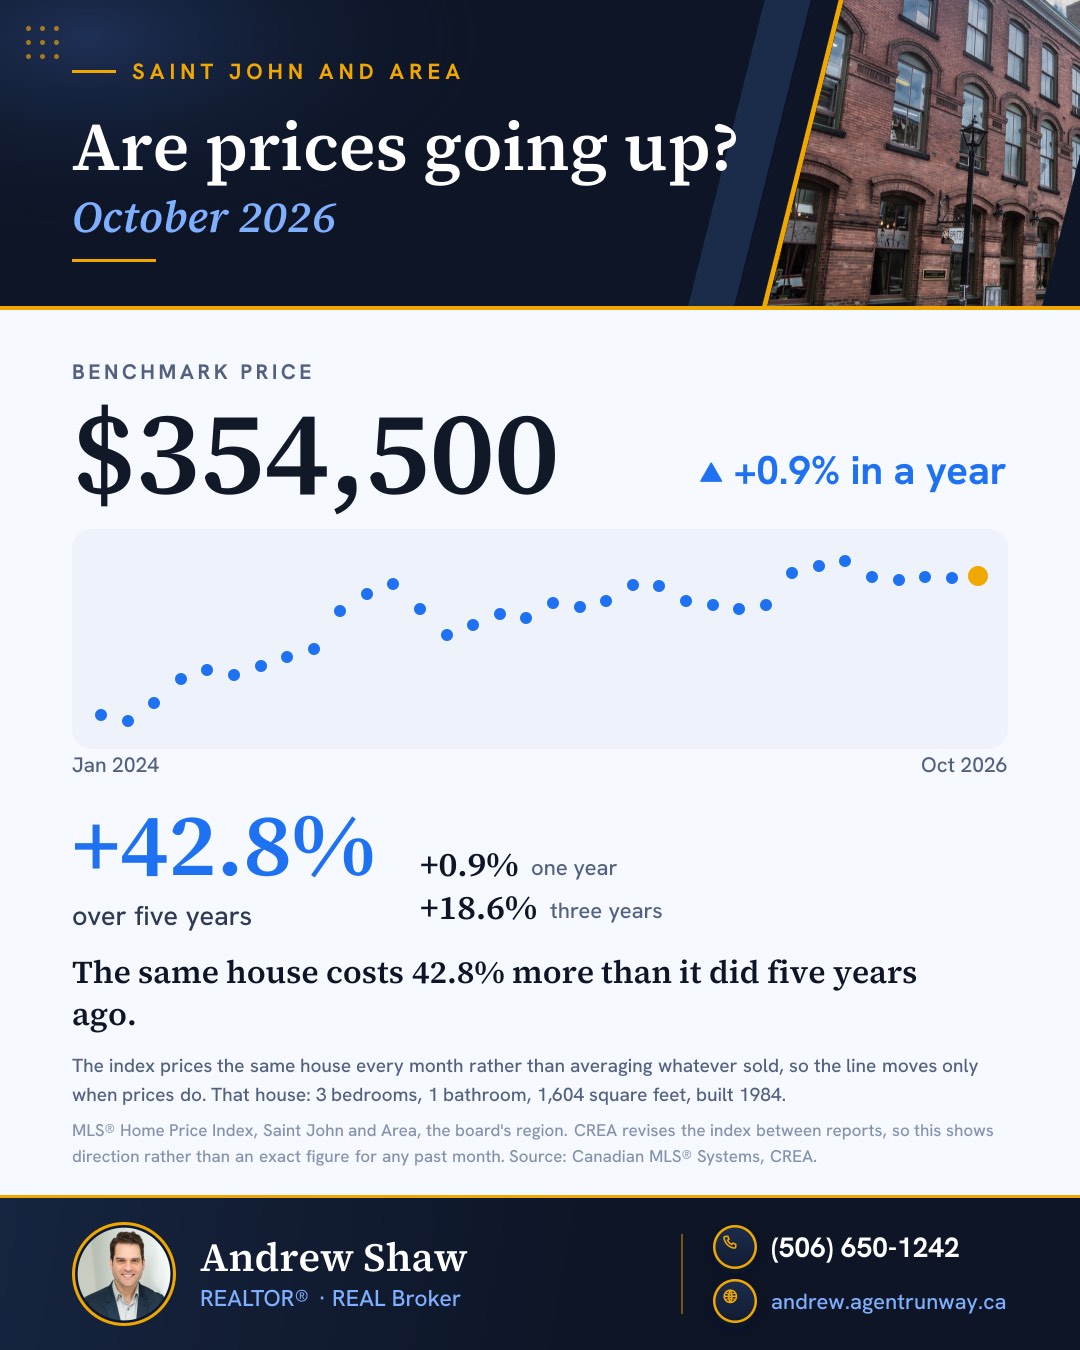
The median sale price, the price with half the homes selling above it and half below, was $333,000, 5.7% above last October. Single-family homes on their own sold for a median of $345,000, up 9.5%. I wouldn’t get excited about either increase, because last October was a low month. New Brunswick REALTORS®, the real estate board that publishes these figures, now has last October’s median at about $315,000, compared with $350,000 the month before and $332,500 the month after. The board’s benchmark price, its estimate for the same typical home every month, is steadier. It sits at $354,500, up 0.9% from a year ago.
Ten months against last year
The first four charts below each set a month of 2026 beside the same month of 2025, both as the board first reported them. The notes at the bottom explain why, for anyone who enjoys that sort of reading.
Sale prices have come back toward asking
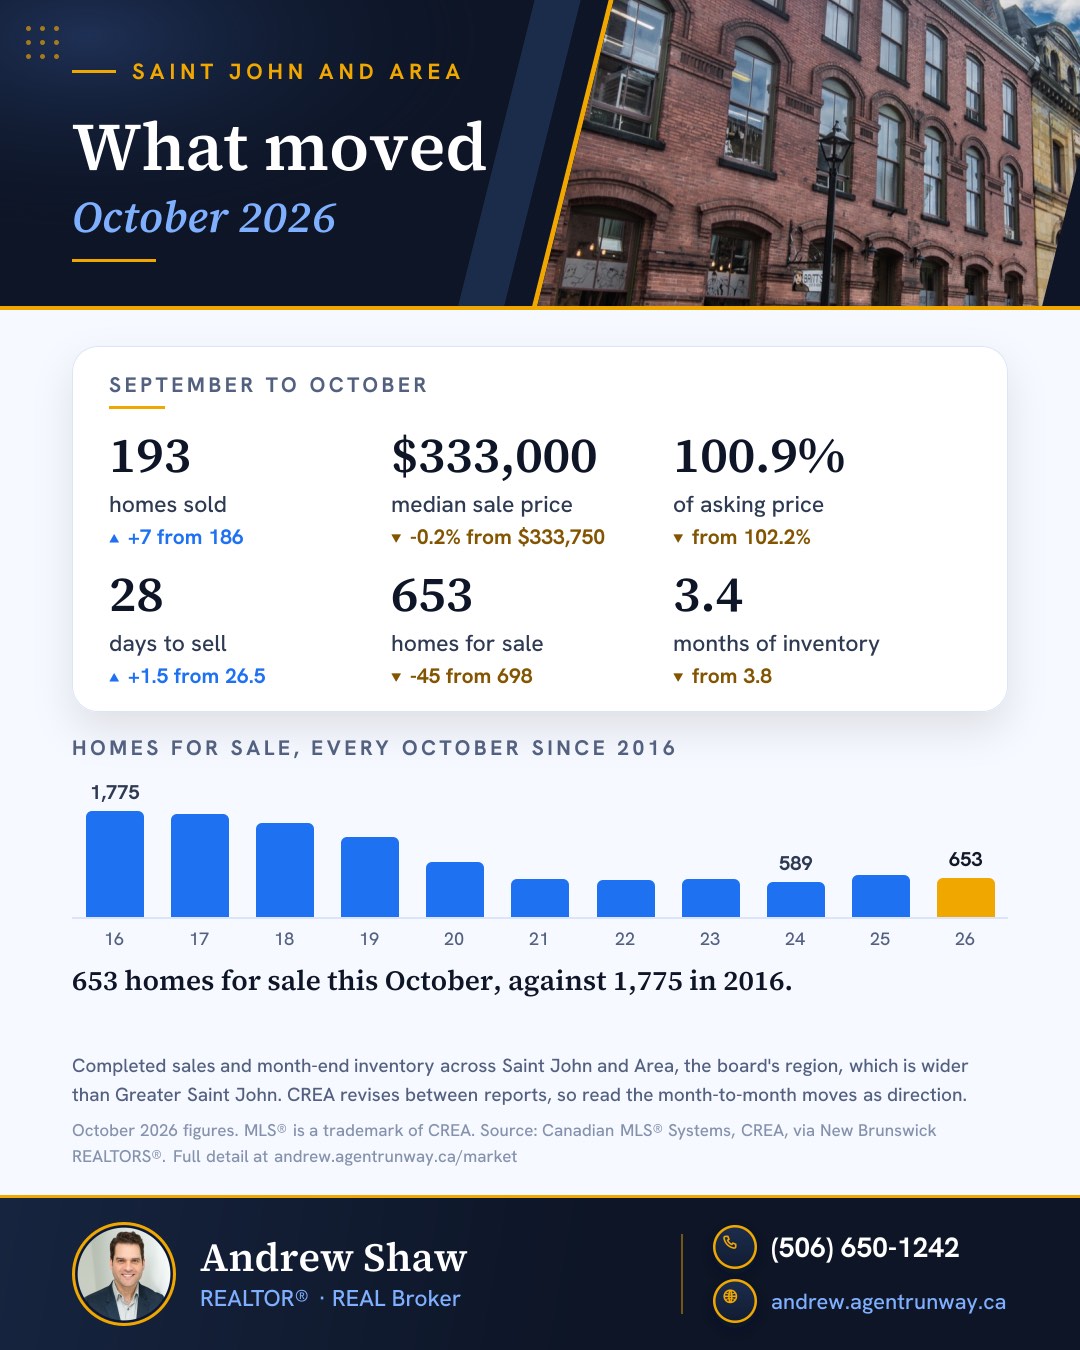
Sale prices as a share of asking have been below last year in every month of 2026 so far. October’s 100.9% is the lowest of any month except January in at least two years. In my September post I wrote that sellers had stopped running up the score on buyers. In October it was closer to a one-goal game, with sellers still ahead. That 100.9% is an average, so some homes sold for more and some for less.
Homes also took a little longer to sell, a median of 28 days compared with 24.5 a year ago. For a seller, that’s about one more weekend of hiding the laundry before showings.
Sale price as a share of asking price, on average
The numbers
| Month | 2025 | 2026 |
|---|---|---|
| Jan | 100.7% | 99.4% |
| Feb | 105% | 102.3% |
| Mar | 103.9% | 102.9% |
| Apr | 106% | 102.6% |
| May | 106.1% | 104.2% |
| Jun | 107.1% | 104.2% |
| Jul | 106.4% | 102.2% |
| Aug | 106.1% | 101.4% |
| Sep | 104% | 102.2% |
| Oct | 104.7% | 100.9% |
Fewer sales and fewer new listings
193 homes sold in October, down from 218 first reported for last October, or about 11% fewer. Adding up each month’s first report from January to October gives 1,706 sales this year, compared with 1,781 last year, a drop of about 4%. Sellers eased off as well. New listings came to 243 in October, down 19% from last October in the board’s report.
Homes sold each month
The numbers
| Month | 2025 | 2026 |
|---|---|---|
| Jan | 95 | 96 |
| Feb | 129 | 94 |
| Mar | 124 | 122 |
| Apr | 170 | 165 |
| May | 203 | 216 |
| Jun | 218 | 212 |
| Jul | 250 | 223 |
| Aug | 207 | 199 |
| Sep | 167 | 186 |
| Oct | 218 | 193 |
The gap in homes for sale has nearly closed
At the end of every month this year, there were more homes for sale than at the same point last year, comparing first reports, and October’s gap was the smallest, 653 compared with 634, or about 3% more. In August it was about 14% more.
Homes for sale at month end
The numbers
| Month | 2025 | 2026 |
|---|---|---|
| Jan | 383 | 417 |
| Feb | 377 | 438 |
| Mar | 456 | 504 |
| Apr | 533 | 598 |
| May | 603 | 648 |
| Jun | 647 | 724 |
| Jul | 655 | 734 |
| Aug | 651 | 740 |
| Sep | 659 | 698 |
| Oct | 634 | 653 |
Still on the sellers’ side of the line
Months of supply asks how long it would take to sell every home now for sale if nobody listed another one. Under four months, sellers have the edge. Between four and six is close to balanced. October came in at 3.4, compared with 2.9 last October. From January to October it has averaged 3.7, compared with 3.2 for the same months last year.
Expect months of supply to climb over the winter, when few homes sell. It reached 4.7 this past February, so a reading over four in January wouldn’t be news.
Months of supply
The numbers
| Month | 2025 | 2026 |
|---|---|---|
| Jan | 4.0 | 4.3 |
| Feb | 2.9 | 4.7 |
| Mar | 3.7 | 4.1 |
| Apr | 3.1 | 3.6 |
| May | 3.0 | 3.0 |
| Jun | 3.0 | 3.4 |
| Jul | 2.6 | 3.3 |
| Aug | 3.1 | 3.7 |
| Sep | 3.9 | 3.8 |
| Oct | 2.9 | 3.4 |
The benchmark price has barely moved since June
The benchmark climbed to $364,500 in May 2026 and came back a little by June. From June to October it has stayed between $354,400 and $356,000. Looking past October alone, the median sale price from January to October was $350,000, up 4.2% from the same months of 2025.
Benchmark price, January 2025 to October 2026
The numbers
| Jan 2025 | $339K |
| Feb 2025 | $325K |
| Mar 2025 | $330K |
| Apr 2025 | $336K |
| May 2025 | $334K |
| Jun 2025 | $342K |
| Jul 2025 | $340K |
| Aug 2025 | $343K |
| Sep 2025 | $352K |
| Oct 2025 | $351K |
| Nov 2025 | $343K |
| Dec 2025 | $341K |
| Jan 2026 | $339K |
| Feb 2026 | $341K |
| Mar 2026 | $358K |
| Apr 2026 | $362K |
| May 2026 | $365K |
| Jun 2026 | $356K |
| Jul 2026 | $354K |
| Aug 2026 | $356K |
| Sep 2026 | $355K |
| Oct 2026 | $355K |
What could move prices this winter
I’ll start with interest rates, because they reach your mortgage first. A few dates I gave you in my September post have also moved, and I’ve corrected them below.
The Bank of Canada raised its key rate
In my September post I compared forecasting interest rates to forecasting fog in Saint John, and the fog rolled in ahead of the forecast. On October 28 the Bank of Canada raised its key rate from 2.25% to 2.5%, its first increase since July 2023. In mid-September, RBC and Desjardins were expecting the first increase early in 2027.
Inflation is the Bank of Canada’s reason. Prices across Canada rose 3.1% over the year to September, or 2.2% leaving out gasoline. In New Brunswick they rose 5.0%, or 2.6% leaving out energy. The Bank expects the national figure to reach about 3½% by the end of the year.
The Bank said there “could be a need to increase the policy rate further,” meaning its key rate, and that it will proceed carefully. Its next decision is December 9, and economists disagree about what comes next. RBC is looking for another increase in December or January and, as a starting assumption, two more after that, to 3.25%. TD sees one more early in 2027, to 2.75%, and CIBC sees the same peak with a pause in December.
Variable-rate mortgages feel the increase first, because they move with the banks’ prime rate, which is now 4.70%. On a $300,000 mortgage over 25 years, a quarter-point increase adds about $42 a month. If your variable mortgage has a fixed payment, that payment may not change, and more of it goes to interest. Fixed rates follow the bond market instead. All six big banks raised some fixed rates in the first half of October, generally by 0.05 to 0.20 of a point. The interest rate on five-year Government of Canada bonds has slipped since the Bank of Canada’s decision, from 3.62% that day to 3.46% on November 2, so that decision doesn’t automatically mean another round of fixed-rate increases.
If your mortgage comes up for renewal in the next year, start talking to your lender or a mortgage broker early.
Still no trade deal with the US
Prime Minister Carney and President Trump have spoken again, and on November 1 Carney said the Canadian and US teams would be working “in the coming weeks” toward a trade agreement. There’s no deal yet, and a source told Radio-Canada, “We are not on the verge of an agreement just yet.” New Brunswick has a lot riding on this, since about 90% of our goods exports go to the United States, according to TD Economics.
My September post said the pulp mill in Nackawic would go idle at the end of October. The River Valley Sun now gives the date as November 4, affecting about 350 workers. The owner, AV Group, blames market conditions and rising costs, and its spokesperson has said US tariffs unsettled global markets. Premier Holt was asked how likely a reopening is and said, “Very unlikely.”
The US ban on many Canadian alcoholic drinks took effect on September 29. Before the ban, Moosehead, which brews here in Saint John, was sending 15% of its production to the US.
Saint John’s own job numbers have held up. Unemployment here was 5.6% in September, on a three-month average, and the province’s rate for the month was 7.4%. TD’s last published forecast, from September, had New Brunswick home prices rising 0.4% this year and 1.8% in 2027. It assumed the Bank of Canada would hold through 2027, so it may change.
Ottawa’s immigration plan is still to come
I told you to watch for Ottawa’s next immigration plan by November 1. Immigration Minister Diab has since said the plan is coming in November, and I couldn’t find it when I wrote this. The federal budget comes on November 5, and I may have more to say about it next month. The newest population count is still the one from Statistics Canada I gave you before, 883,522 people in New Brunswick on July 1, up 0.6% in a single quarter.
Closer to home
The biggest local news of the month was the $463 million Ottawa and the province announced for Saint John’s port and its rail and road links, which I wrote about separately. Premier Holt has said the work could start in spring 2027. I don’t expect the money to move prices this winter.
New construction has been about flat. Builders in Greater Saint John started 411 homes from January to September, compared with 419 a year earlier, and single-family starts fell to 148 from 175.
If you own or are buying a home with a rental unit, the 3% cap on rent increases stays in place through 2027. The rewrite of the Residential Tenancies Act that I said was expected this fall is now promised for spring.
I also need to correct myself on property taxes. I told you that the province’s property tax reform, Bill 49, had been tabled, meaning introduced in the legislature. In fact it received Royal Assent, which makes it law, on June 12. For what it means for a particular home, the province’s own explanation is the place to start.
My read
I expect the drift toward a balanced market to carry on through the winter, and the rate increase gives it a push. I don’t expect prices to fall much while supply stays near four months and homes sell for about what they’re listed for.
Sources for this section
- Bank of Canada, rate announcement, 28 October 2026
- Statistics Canada, Consumer Price Index, September 2026
- Statistics Canada, provincial CPI table, September 2026
- RBC, after the decision, 28 October 2026
- TD Economics, after the decision, 28 October 2026
- Canadian Mortgage Trends, CIBC's view, 2 November 2026
- Canadian Mortgage Trends, banks raise prime, 28 October 2026
- Canadian Mortgage Trends, banks raise fixed rates, 15 October 2026
- Bank of Canada, five-year bond yields
- CBC, Carney and Trump on trade talks, 1 November 2026
- River Valley Sun, the Nackawic mill, 1 November 2026
- River Valley Sun, Premier Holt on the mill, 16 October 2026
- CP24, AV Group's statement on the mill, 17 September 2026
- Canadian Press via National Newswatch, the mill's spokesperson, 18 September 2026
- US Proclamation 11061, the ban on Canadian alcohol
- CBC, Moosehead and the US ban, 9 September 2026
- Statistics Canada, Labour Force Survey, September 2026
- Statistics Canada, unemployment by city, September 2026
- TD Economics, provincial economic forecast, 21 September 2026
- TD Economics, provincial housing outlook, 29 September 2026
- CP24, Minister Diab on the immigration plan, 16 October 2026
- CP24, the federal budget date, 20 October 2026
- Statistics Canada, population estimates, 23 September 2026
- Government of New Brunswick, Speech from the Throne, October 2026
- Government of New Brunswick, rent cap kept for 2027, 24 June 2026
- Legislative Assembly of New Brunswick, Bill 49, property tax reform
- Government of New Brunswick, the property tax reforms, 27 May 2026
- Baird Maritime, Premier Holt on the port's timeline
- CMHC, housing starts, September 2026
If you’re selling or buying this winter
If you’re selling, price your home for what it’s worth from the first day. A year ago you could list low and let buyers bid it up. With homes selling close to asking on average, a low asking price is more likely to become your sale price, and a home priced high is more likely to sit through the winter.
If you’re buying, you’ll face less bidding than you did a year ago, and you don’t need to assume you’ll pay $16,000 over asking on a $350,000 house. A well-priced house can still draw a crowd, so get your financing sorted before you go looking.
The figures in this post are averages and medians across a wide region. If you want to know what they mean for your street or your price range, get in touch or call me at (506) 650-1242.